29
/
en
AIzaSyAYiBZKx7MnpbEhh9jyipgxe19OcubqV5w
April 1, 2024
169662
Korea, Rep.
KOR
true
2
1
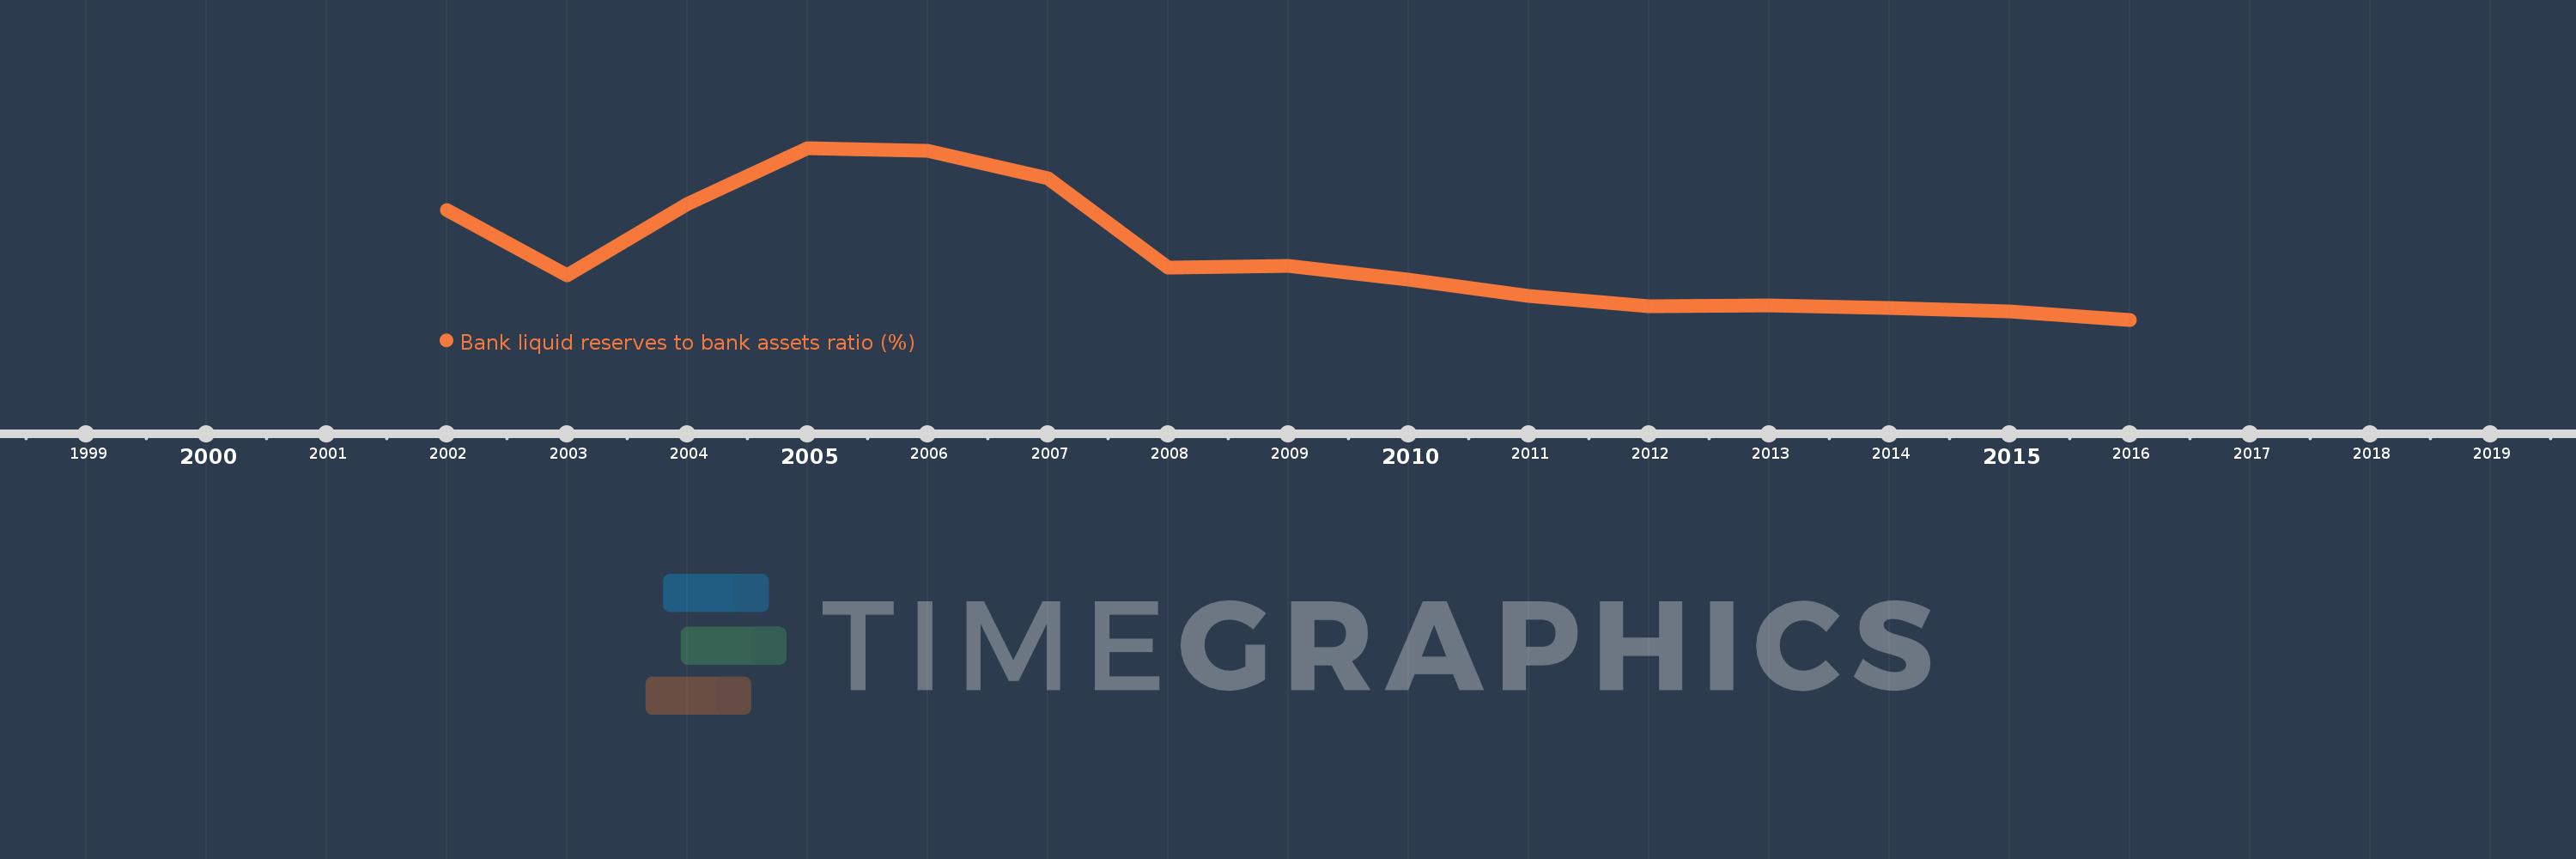
Bank liquid reserves to bank assets ratio (%)
2016,2015,2014,2013,2012,2011,2010,2009,2008,2007,2006,2005,2004,2003,2002
This statistics in other country:
Timeline:
This timeline shows a graph from 2002 to 2016 of Korea, Rep.. No data until 2001. Number of actual observations by date: 15.
Source name:
World Development Indicators
Source organization:
International Monetary Fund, International Financial Statistics and data files.
Categories, topics:
Financial Sector
Last updated:
apr 23, 2017
Indicators value changes by year
Maximum:
10.592
jan 1, 2005
At the date of observation
Value
Absolute change
Change from previous value
jan 1, 2002
9.243
+9.243
0.0%
jan 1, 2003
7.832
-1.411
-15.26%
jan 1, 2004
9.38
+1.548
19.76%
jan 1, 2005
10.592
+1.212
12.92%
jan 1, 2006
10.534
-0.058
-0.55%
jan 1, 2007
9.934
-0.6
-5.7%
jan 1, 2008
7.983
-1.951
-19.64%
jan 1, 2009
8.02
+0.037
0.47%
jan 1, 2010
7.737
-0.283
-3.53%
jan 1, 2011
7.381
-0.356
-4.6%
jan 1, 2012
7.159
-0.222
-3.01%
jan 1, 2013
7.179
+0.02
0.28%
jan 1, 2014
7.105
-0.075
-1.04%
jan 1, 2015
7.043
-0.062
-0.87%
jan 1, 2016
6.858
-0.185
-2.62%
Ranking of countries by current statistics by years


Comments: