29
/
en
AIzaSyAYiBZKx7MnpbEhh9jyipgxe19OcubqV5w
April 1, 2024
229461
Russian Federation
RUS
true
2
1
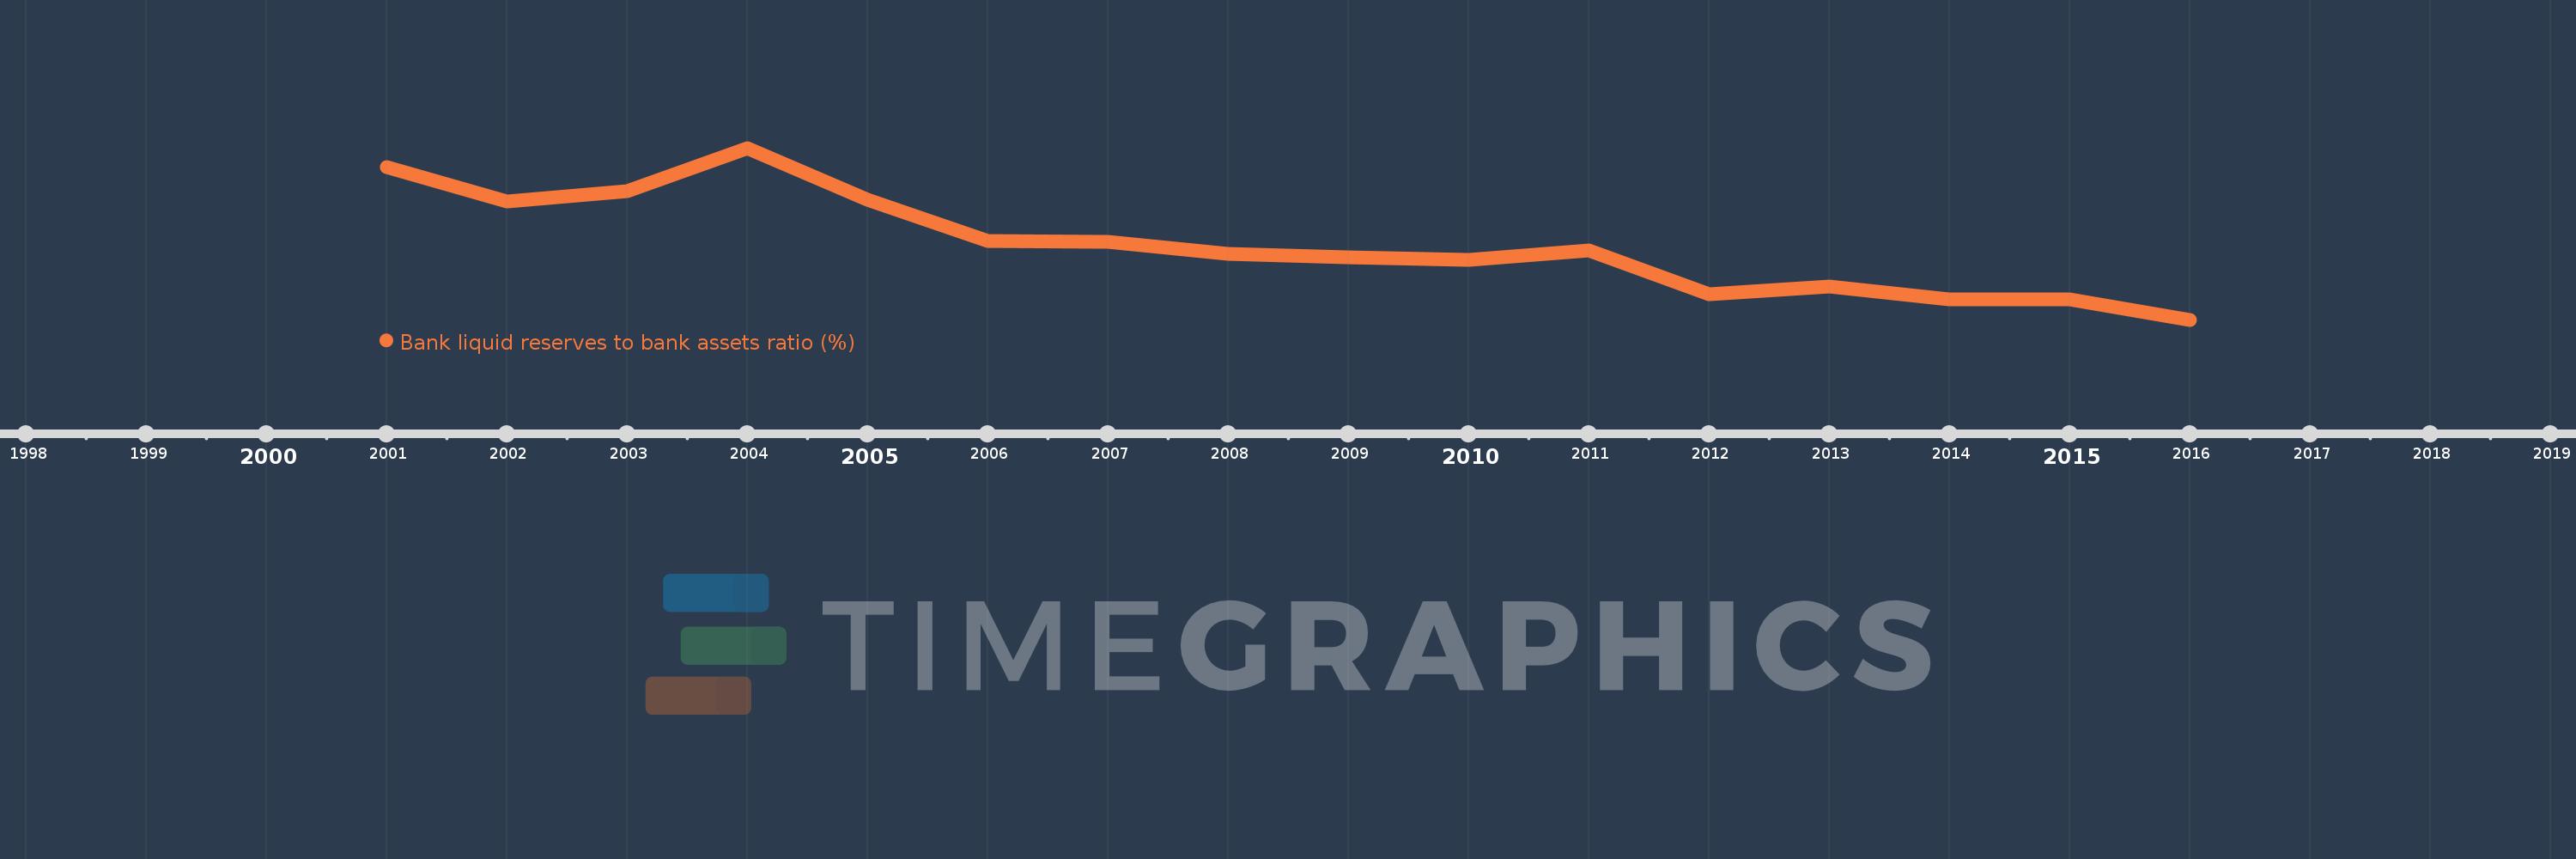
Bank liquid reserves to bank assets ratio (%)
2016,2015,2014,2013,2012,2011,2010,2009,2008,2007,2006,2005,2004,2003,2002,2001
This statistics in other country:
Timeline:
This timeline shows a graph from 2001 to 2016 of Russian Federation. No data until 2000. Number of actual observations by date: 16.
Source name:
World Development Indicators
Source organization:
International Monetary Fund, International Financial Statistics and data files.
Categories, topics:
Financial Sector
Last updated:
apr 23, 2017
Indicators value changes by year
Maximum:
21.321
jan 1, 2004
At the date of observation
Value
Absolute change
Change from previous value
jan 1, 2001
19.63
+19.63
0.0%
jan 1, 2002
16.528
-3.102
-15.8%
jan 1, 2003
17.426
+0.898
5.44%
jan 1, 2004
21.321
+3.895
22.35%
jan 1, 2005
16.671
-4.65
-21.81%
jan 1, 2006
12.975
-3.695
-22.17%
jan 1, 2007
12.873
-0.102
-0.79%
jan 1, 2008
11.824
-1.048
-8.14%
jan 1, 2009
11.52
-0.304
-2.57%
jan 1, 2010
11.253
-0.267
-2.32%
jan 1, 2011
12.107
+0.854
7.59%
jan 1, 2012
8.188
-3.919
-32.37%
jan 1, 2013
8.845
+0.656
8.02%
jan 1, 2014
7.695
-1.15
-13.0%
jan 1, 2015
7.72
+0.025
0.33%
jan 1, 2016
5.863
-1.857
-24.06%
Ranking of countries by current statistics by years


Comments: