29
/
en
AIzaSyAYiBZKx7MnpbEhh9jyipgxe19OcubqV5w
April 1, 2024
165840
Kazakhstan
KAZ
true
2
1
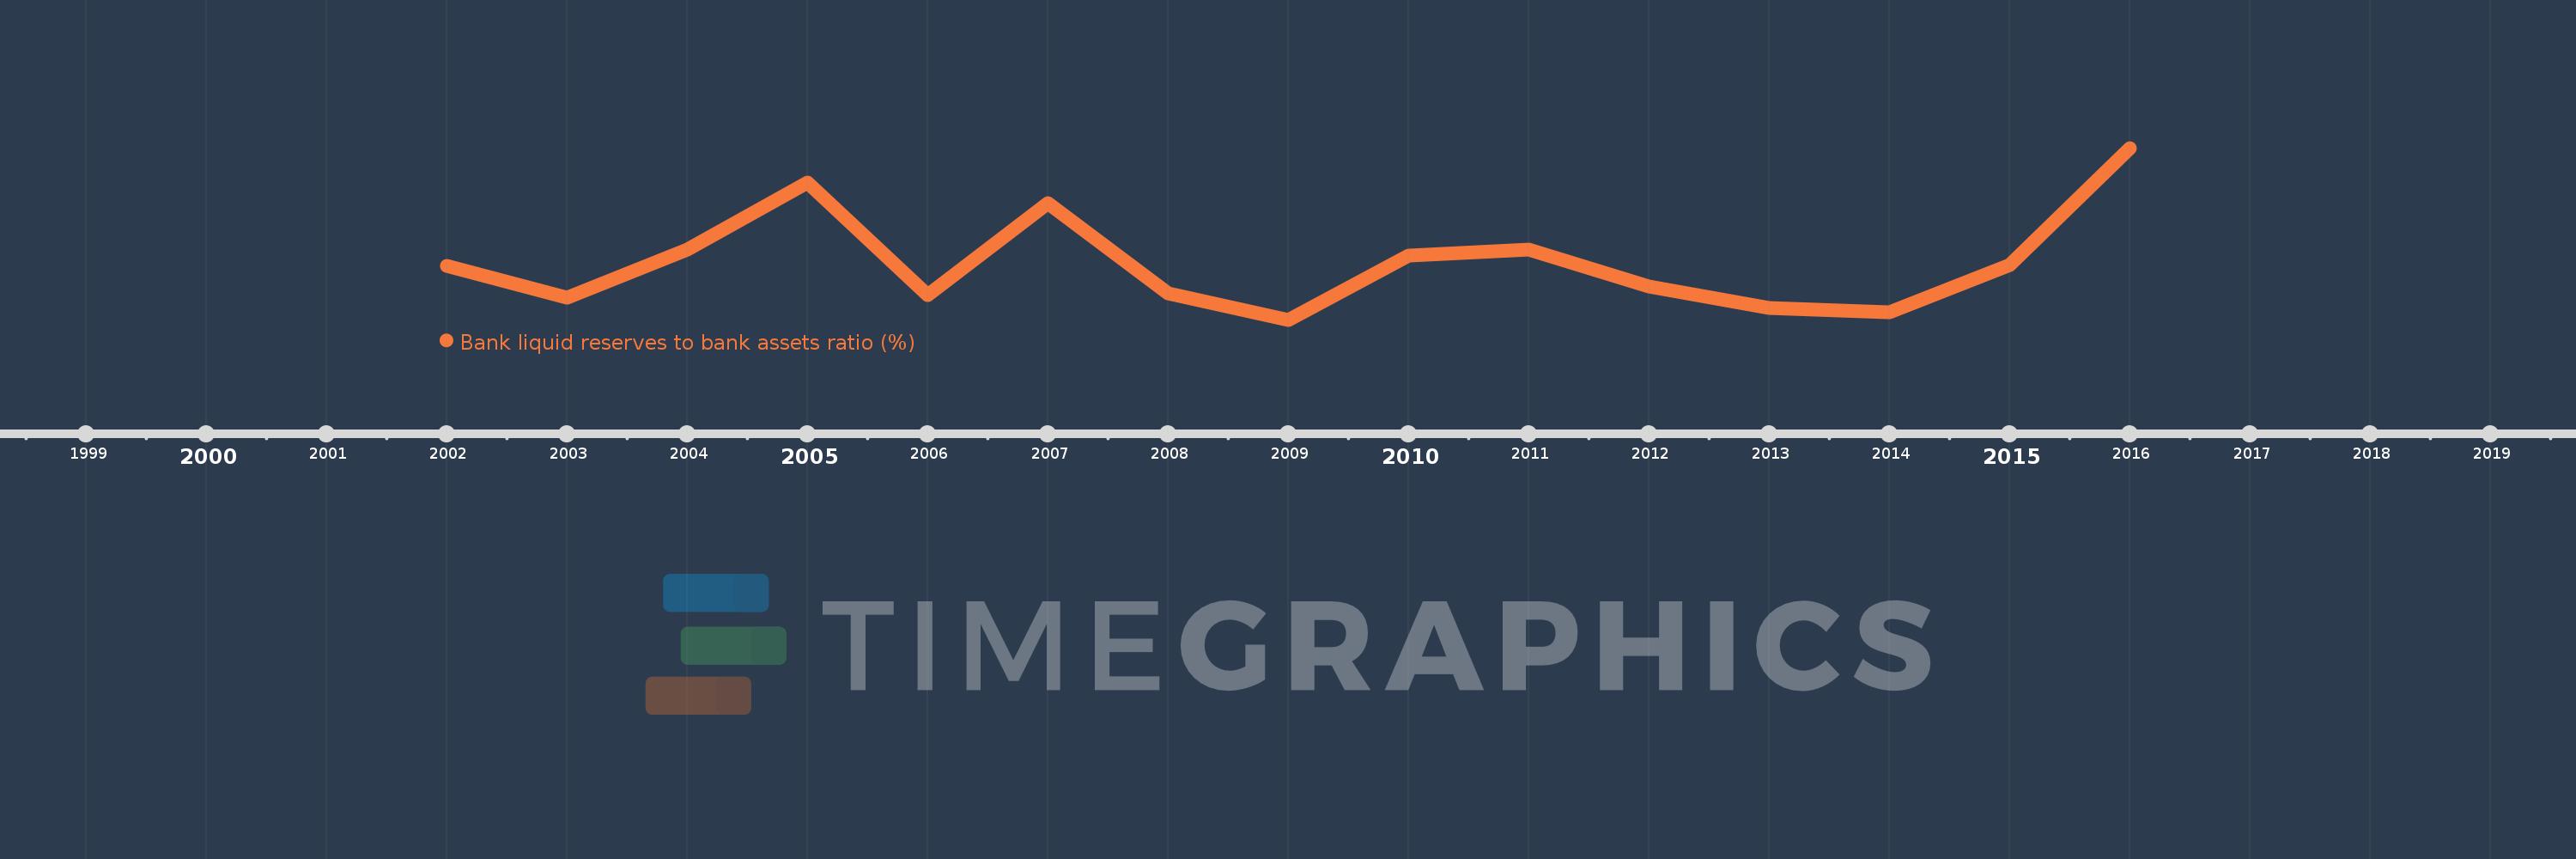
Bank liquid reserves to bank assets ratio (%)
2016,2015,2014,2013,2012,2011,2010,2009,2008,2007,2006,2005,2004,2003,2002
This statistics in other country:
Timeline:
This timeline shows a graph from 2002 to 2016 of Kazakhstan. No data until 2001. Number of actual observations by date: 15.
Source name:
World Development Indicators
Source organization:
International Monetary Fund, International Financial Statistics and data files.
Categories, topics:
Financial Sector
Last updated:
apr 23, 2017
Indicators value changes by year
Maximum:
21.554
jan 1, 2016
At the date of observation
Value
Absolute change
Change from previous value
jan 1, 2002
10.435
+10.435
0.0%
jan 1, 2003
7.48
-2.956
-28.32%
jan 1, 2004
12.038
+4.559
60.95%
jan 1, 2005
18.296
+6.257
51.98%
jan 1, 2006
7.689
-10.606
-57.97%
jan 1, 2007
16.397
+8.708
113.24%
jan 1, 2008
7.916
-8.481
-51.72%
jan 1, 2009
5.407
-2.508
-31.69%
jan 1, 2010
11.45
+6.043
111.75%
jan 1, 2011
12.03
+0.58
5.06%
jan 1, 2012
8.537
-3.493
-29.03%
jan 1, 2013
6.506
-2.031
-23.79%
jan 1, 2014
6.082
-0.424
-6.52%
jan 1, 2015
10.536
+4.454
73.24%
jan 1, 2016
21.554
+11.018
104.57%
Ranking of countries by current statistics by years


Comments: