29
/
en
AIzaSyAYiBZKx7MnpbEhh9jyipgxe19OcubqV5w
April 1, 2024
127169
Equatorial Guinea
GNQ
true
2
1
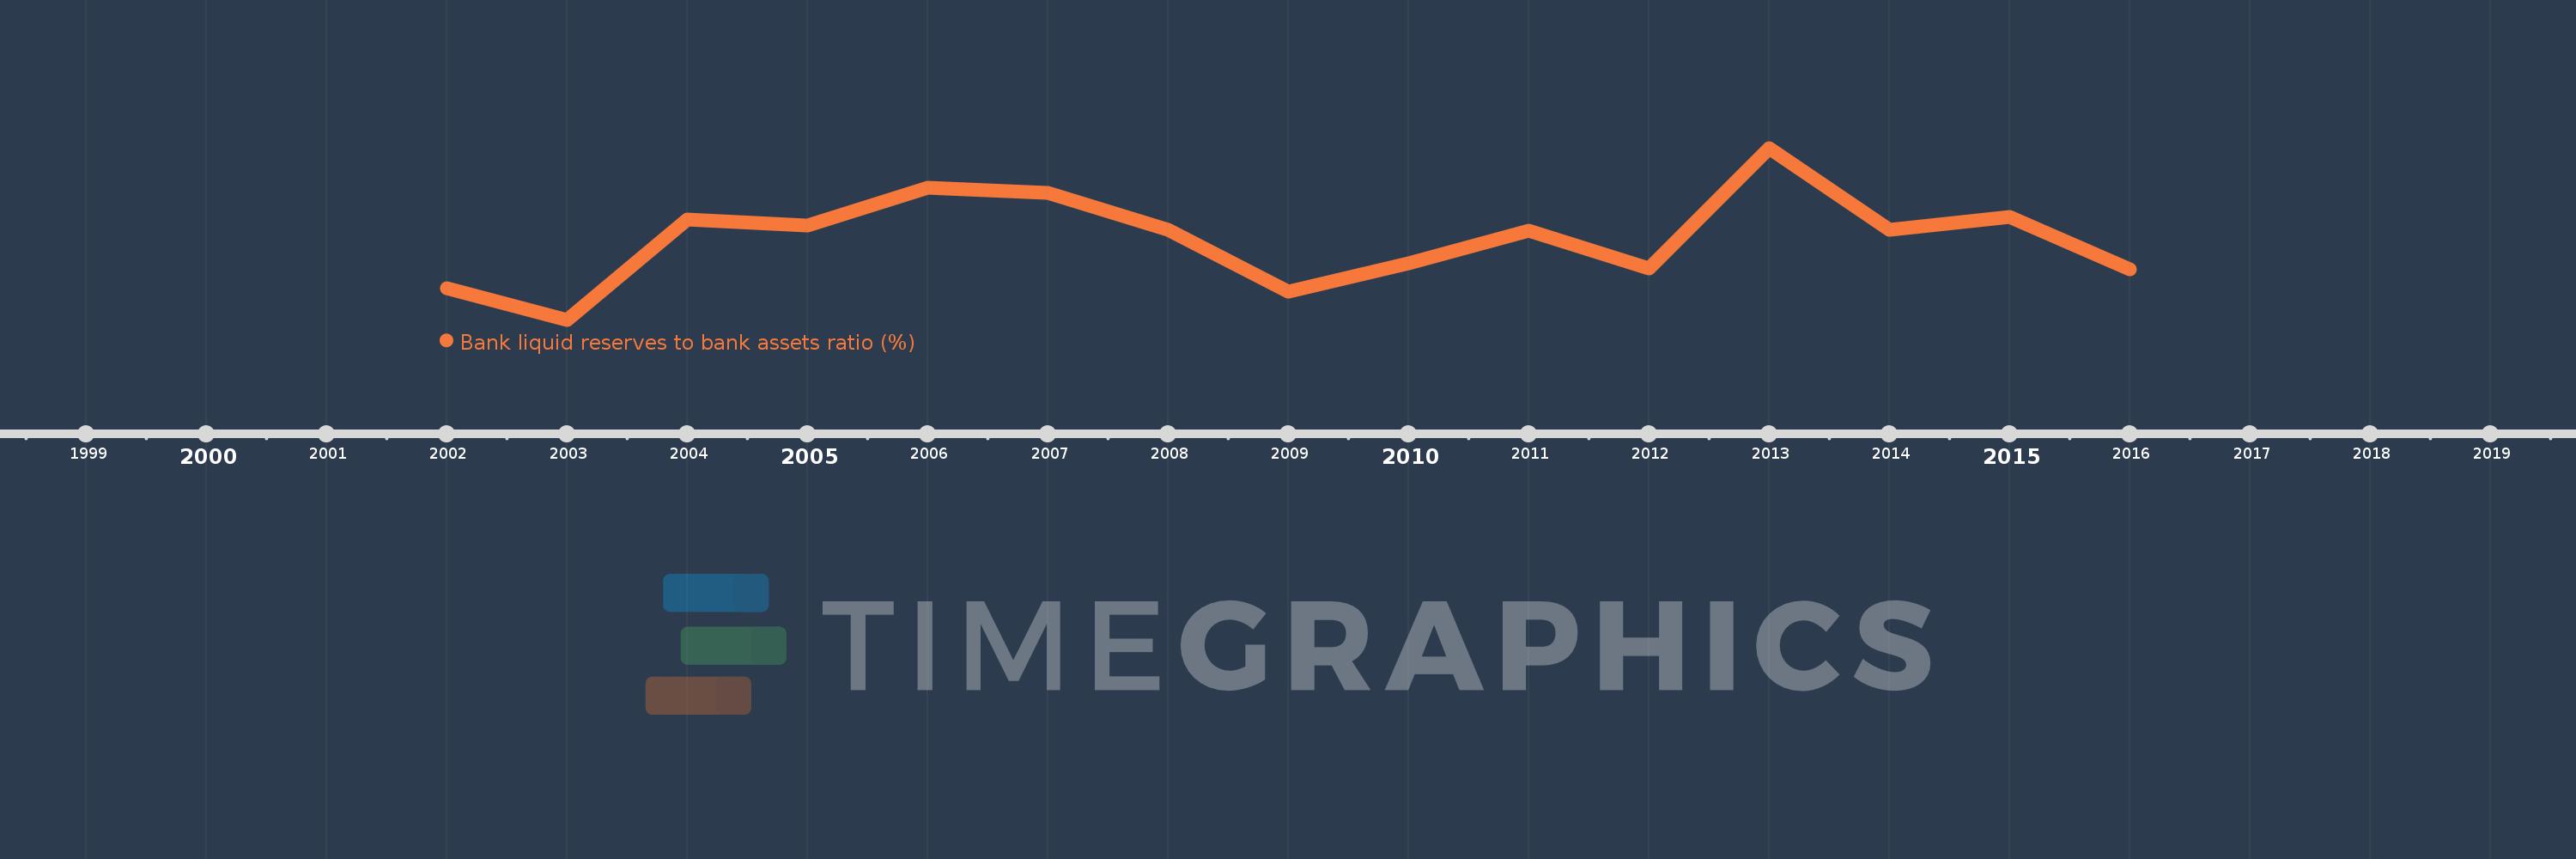
Bank liquid reserves to bank assets ratio (%)
2016,2015,2014,2013,2012,2011,2010,2009,2008,2007,2006,2005,2004,2003,2002
This statistics in other country:
Timeline:
This timeline shows a graph from 2002 to 2016 of Equatorial Guinea. No data until 2001. Number of actual observations by date: 15.
Source name:
World Development Indicators
Source organization:
International Monetary Fund, International Financial Statistics and data files.
Categories, topics:
Financial Sector
Last updated:
apr 23, 2017
Indicators value changes by year
Minimum:
18.916
jan 1, 2003
Maximum:
145.529
jan 1, 2013
At the date of observation
Value
Absolute change
Change from previous value
jan 1, 2002
42.05
+42.05
0.0%
jan 1, 2003
18.916
-23.134
-55.02%
jan 1, 2004
92.803
+73.888
390.62%
jan 1, 2005
88.574
-4.23
-4.56%
jan 1, 2006
116.102
+27.528
31.08%
jan 1, 2007
112.319
-3.783
-3.26%
jan 1, 2008
85.345
-26.974
-24.02%
jan 1, 2009
39.907
-45.438
-53.24%
jan 1, 2010
60.634
+20.727
51.94%
jan 1, 2011
84.593
+23.959
39.51%
jan 1, 2012
56.827
-27.766
-32.82%
jan 1, 2013
145.529
+88.702
156.09%
jan 1, 2014
85.149
-60.38
-41.49%
jan 1, 2015
94.783
+9.635
11.32%
jan 1, 2016
56.302
-38.482
-40.6%
Ranking of countries by current statistics by years


Comments: