29
/
en
AIzaSyAYiBZKx7MnpbEhh9jyipgxe19OcubqV5w
April 1, 2024
124491
Egypt, Arab Rep.
EGY
true
2
1
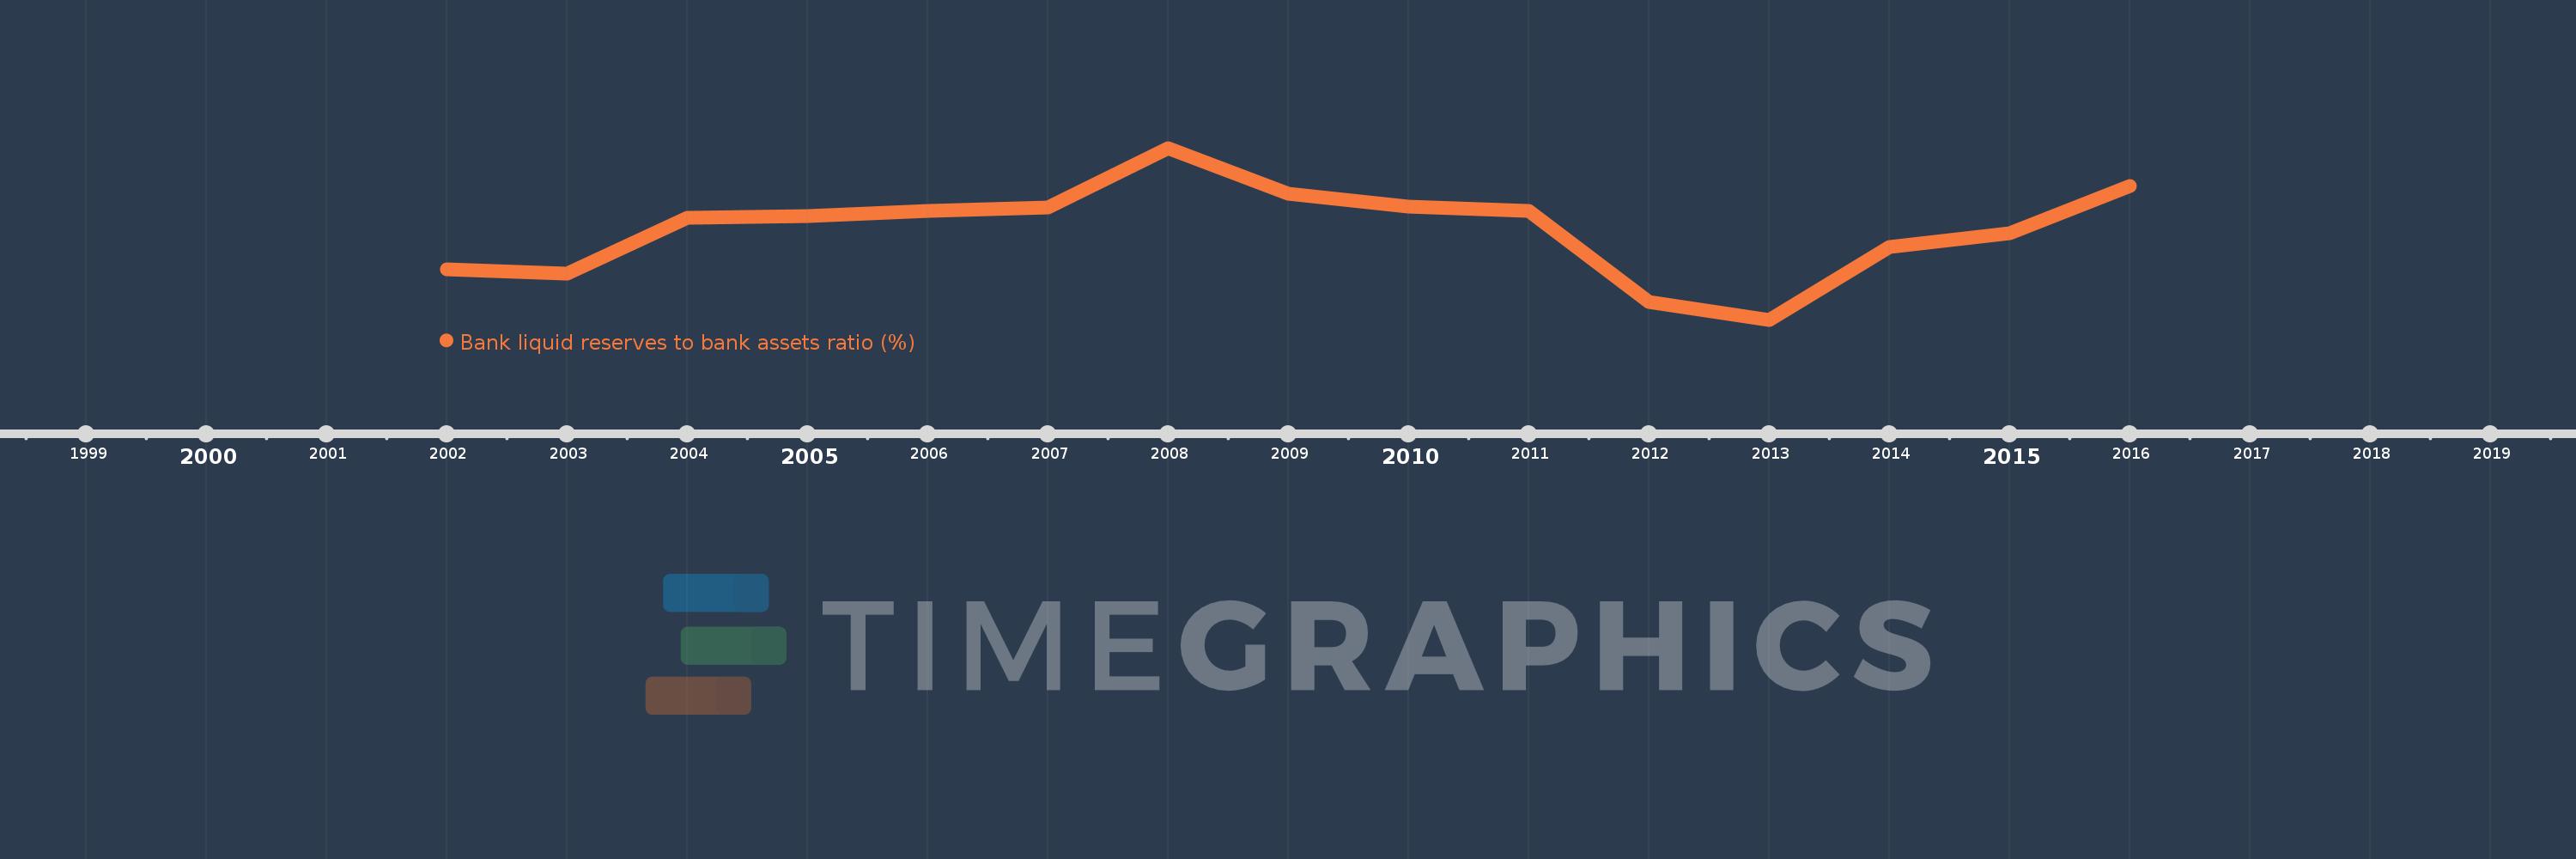
Bank liquid reserves to bank assets ratio (%)
2016,2015,2014,2013,2012,2011,2010,2009,2008,2007,2006,2005,2004,2003,2002
This statistics in other country:
Timeline:
This timeline shows a graph from 2002 to 2016 of Egypt, Arab Rep.. No data until 2001. Number of actual observations by date: 15.
Source name:
World Development Indicators
Source organization:
International Monetary Fund, International Financial Statistics and data files.
Categories, topics:
Financial Sector
Last updated:
apr 23, 2017
Indicators value changes by year
Maximum:
44.852
jan 1, 2008
At the date of observation
Value
Absolute change
Change from previous value
jan 1, 2002
22.608
+22.608
0.0%
jan 1, 2003
21.868
-0.739
-3.27%
jan 1, 2004
32.137
+10.269
46.96%
jan 1, 2005
32.446
+0.309
0.96%
jan 1, 2006
33.379
+0.932
2.87%
jan 1, 2007
34.046
+0.667
2.0%
jan 1, 2008
44.852
+10.806
31.74%
jan 1, 2009
36.51
-8.342
-18.6%
jan 1, 2010
34.161
-2.35
-6.44%
jan 1, 2011
33.308
-0.852
-2.49%
jan 1, 2012
16.762
-16.546
-49.68%
jan 1, 2013
13.45
-3.312
-19.76%
jan 1, 2014
26.792
+13.342
99.2%
jan 1, 2015
29.288
+2.496
9.31%
jan 1, 2016
37.939
+8.65
29.54%
Ranking of countries by current statistics by years


Comments: