29
/
en
AIzaSyAYiBZKx7MnpbEhh9jyipgxe19OcubqV5w
April 1, 2024
216068
Pakistan
PAK
true
2
1
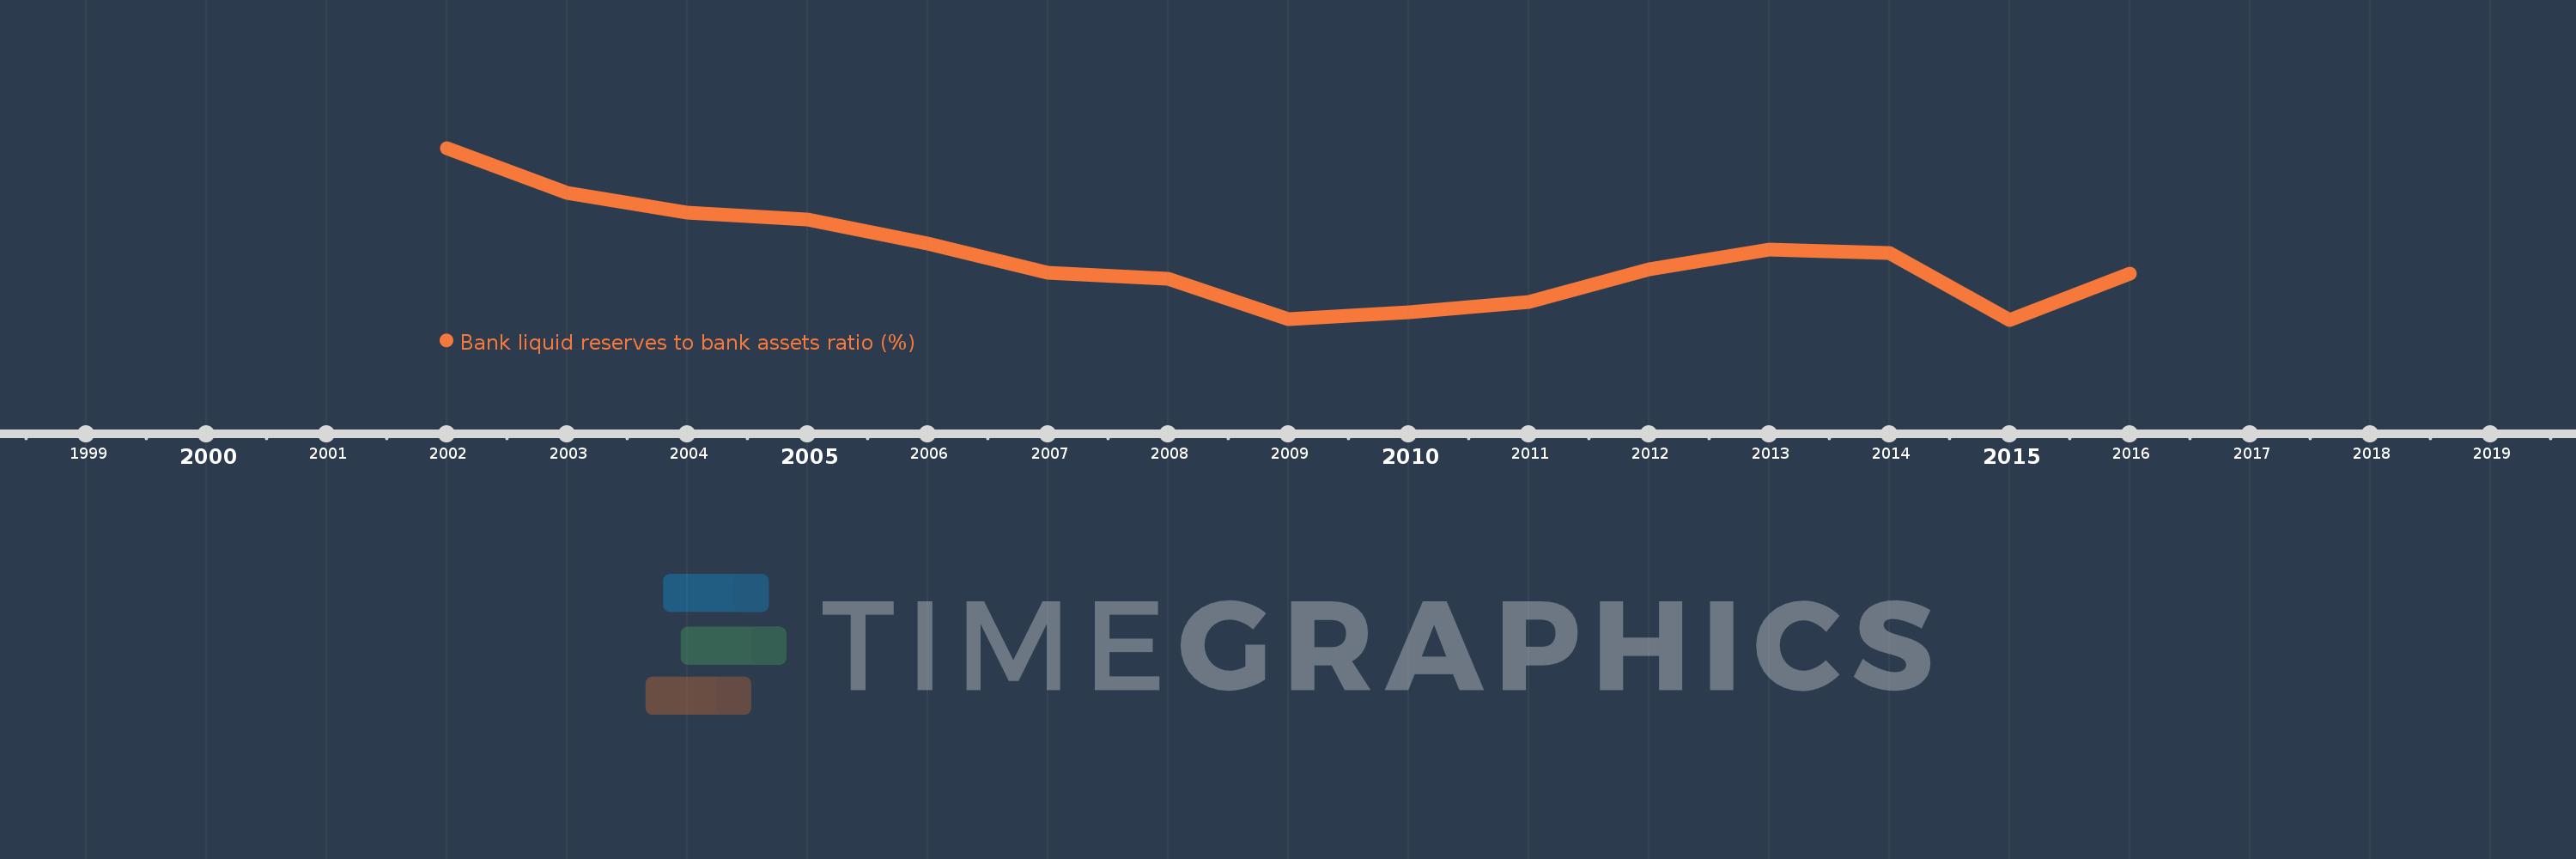
Bank liquid reserves to bank assets ratio (%)
2016,2015,2014,2013,2012,2011,2010,2009,2008,2007,2006,2005,2004,2003,2002
This statistics in other country:
Timeline:
This timeline shows a graph from 2002 to 2016 of Pakistan. No data until 2001. Number of actual observations by date: 15.
Source name:
World Development Indicators
Source organization:
International Monetary Fund, International Financial Statistics and data files.
Categories, topics:
Financial Sector
Last updated:
apr 23, 2017
Indicators value changes by year
Maximum:
19.059
jan 1, 2002
At the date of observation
Value
Absolute change
Change from previous value
jan 1, 2002
19.059
+19.059
0.0%
jan 1, 2003
16.305
-2.754
-14.45%
jan 1, 2004
15.133
-1.172
-7.19%
jan 1, 2005
14.675
-0.457
-3.02%
jan 1, 2006
13.217
-1.458
-9.94%
jan 1, 2007
11.48
-1.737
-13.14%
jan 1, 2008
11.084
-0.396
-3.45%
jan 1, 2009
8.638
-2.446
-22.07%
jan 1, 2010
9.052
+0.414
4.79%
jan 1, 2011
9.682
+0.629
6.95%
jan 1, 2012
11.651
+1.97
20.34%
jan 1, 2013
12.852
+1.201
10.31%
jan 1, 2014
12.683
-0.169
-1.31%
jan 1, 2015
8.593
-4.09
-32.25%
jan 1, 2016
11.42
+2.827
32.89%
Ranking of countries by current statistics by years


Comments: