29
/
en
AIzaSyAYiBZKx7MnpbEhh9jyipgxe19OcubqV5w
April 1, 2024
230710
Rwanda
RWA
true
2
1
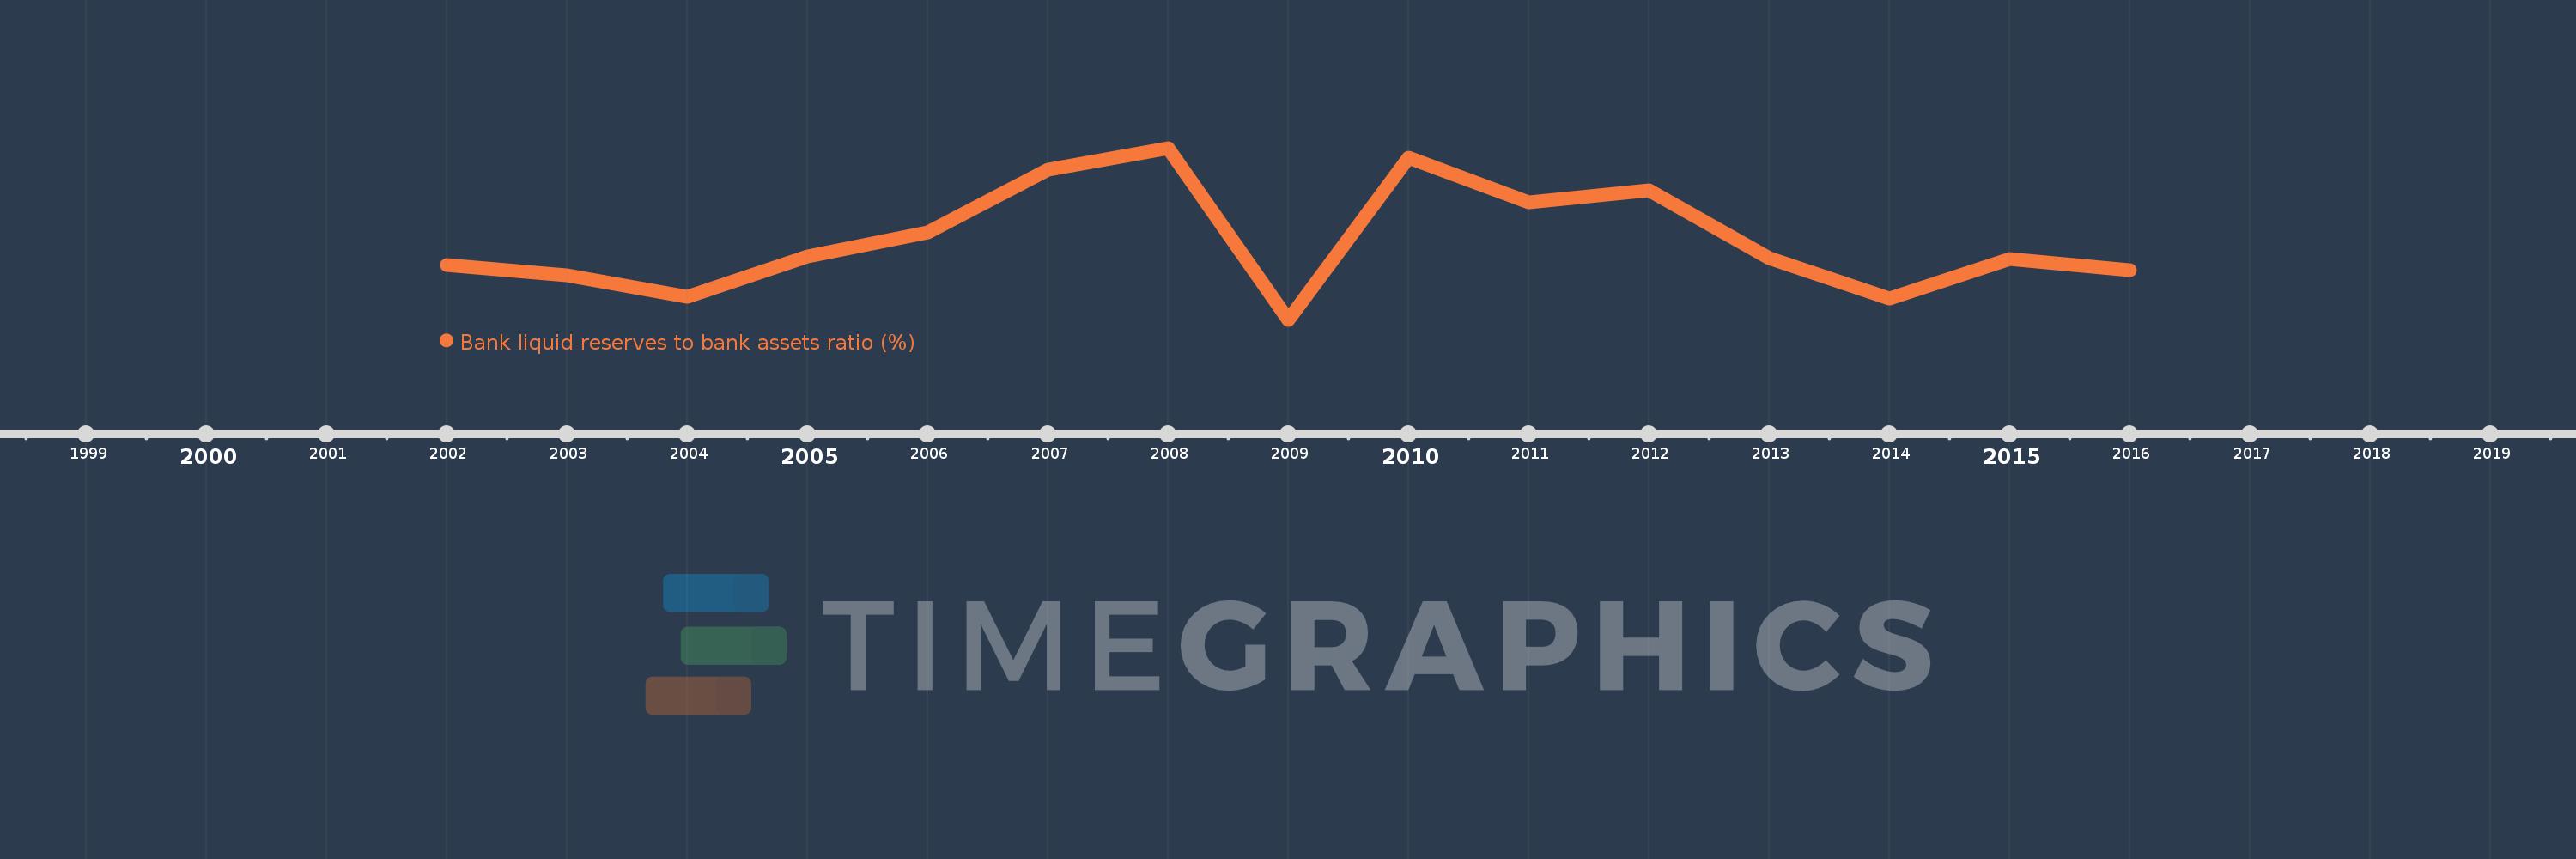
Bank liquid reserves to bank assets ratio (%)
2016,2015,2014,2013,2012,2011,2010,2009,2008,2007,2006,2005,2004,2003,2002
This statistics in other country:
Timeline:
This timeline shows a graph from 2002 to 2016 of Rwanda. No data until 2001. Number of actual observations by date: 15.
Source name:
World Development Indicators
Source organization:
International Monetary Fund, International Financial Statistics and data files.
Categories, topics:
Financial Sector
Last updated:
apr 23, 2017
Indicators value changes by year
Maximum:
23.706
jan 1, 2008
At the date of observation
Value
Absolute change
Change from previous value
jan 1, 2002
13.867
+13.867
0.0%
jan 1, 2003
12.963
-0.904
-6.52%
jan 1, 2004
11.162
-1.801
-13.9%
jan 1, 2005
14.564
+3.403
30.49%
jan 1, 2006
16.605
+2.041
14.01%
jan 1, 2007
21.878
+5.273
31.75%
jan 1, 2008
23.706
+1.828
8.36%
jan 1, 2009
9.249
-14.456
-60.98%
jan 1, 2010
22.861
+13.611
147.16%
jan 1, 2011
19.155
-3.706
-16.21%
jan 1, 2012
20.163
+1.008
5.26%
jan 1, 2013
14.443
-5.721
-28.37%
jan 1, 2014
11.003
-3.44
-23.82%
jan 1, 2015
14.395
+3.392
30.82%
jan 1, 2016
13.405
-0.99
-6.88%
Ranking of countries by current statistics by years


Comments: