29
/
en
AIzaSyAYiBZKx7MnpbEhh9jyipgxe19OcubqV5w
April 1, 2024
34781
Heavily indebted poor countries (HIPC)
HPC
false
2
1
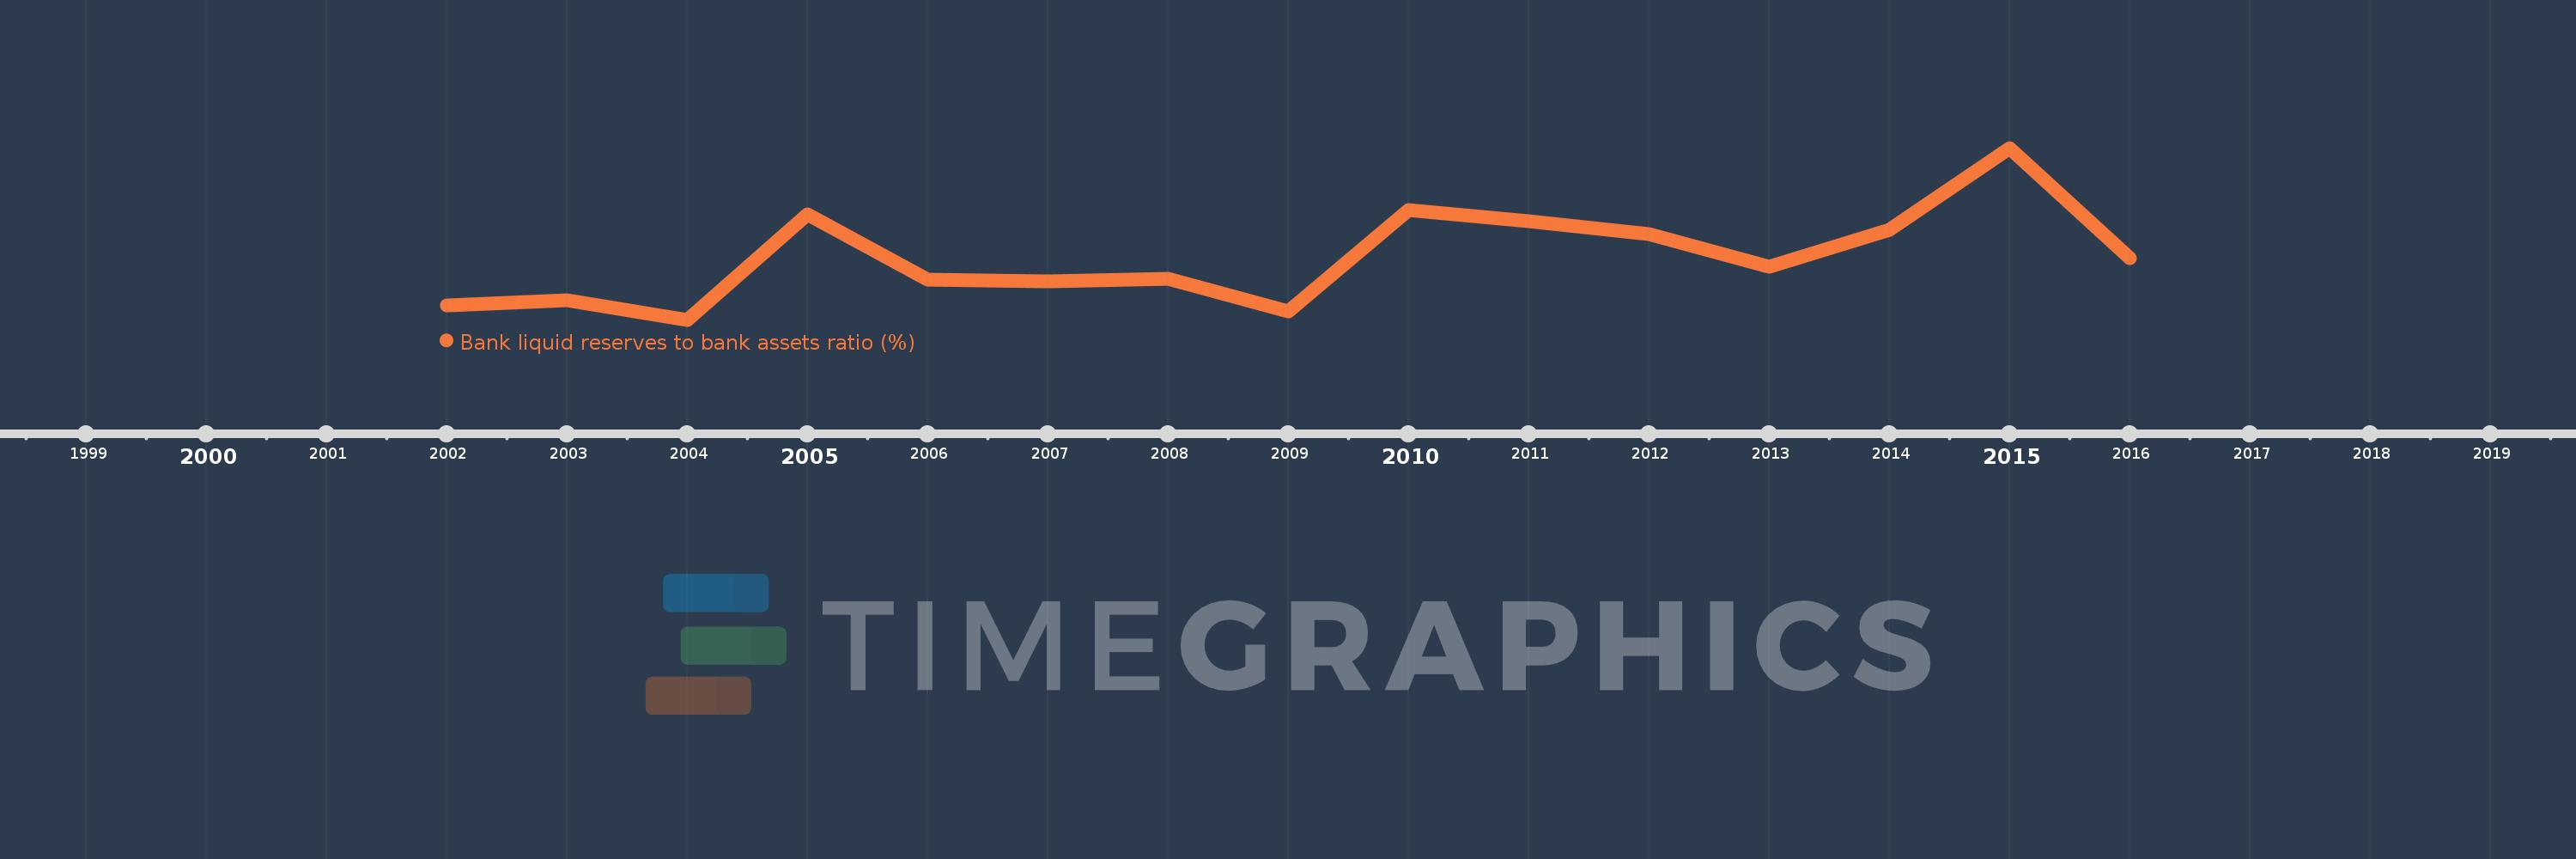
Bank liquid reserves to bank assets ratio (%)
2016,2015,2014,2013,2012,2011,2010,2009,2008,2007,2006,2005,2004,2003,2002
This statistics in other country:
Timeline:
This timeline shows a graph from 2002 to 2016 of Heavily indebted poor countries (HIPC). No data until 2001. Number of actual observations by date: 15.
Source name:
World Development Indicators
Source organization:
International Monetary Fund, International Financial Statistics and data files.
Categories, topics:
Financial Sector
Last updated:
apr 23, 2017
Indicators value changes by year
Minimum:
17.901
jan 1, 2004
Maximum:
24.441
jan 1, 2015
At the date of observation
Value
Absolute change
Change from previous value
jan 1, 2002
18.449
+18.449
0.0%
jan 1, 2003
18.642
+0.194
1.05%
jan 1, 2004
17.901
-0.741
-3.97%
jan 1, 2005
21.907
+4.006
22.38%
jan 1, 2006
19.432
-2.475
-11.3%
jan 1, 2007
19.379
-0.053
-0.28%
jan 1, 2008
19.454
+0.075
0.39%
jan 1, 2009
18.21
-1.244
-6.4%
jan 1, 2010
22.076
+3.866
21.23%
jan 1, 2011
21.651
-0.425
-1.93%
jan 1, 2012
21.166
-0.485
-2.24%
jan 1, 2013
19.905
-1.261
-5.96%
jan 1, 2014
21.311
+1.406
7.06%
jan 1, 2015
24.441
+3.13
14.69%
jan 1, 2016
20.243
-4.198
-17.18%
Ranking of countries by current statistics by years


Comments: