29
/
en
AIzaSyAYiBZKx7MnpbEhh9jyipgxe19OcubqV5w
April 1, 2024
36381
IBRD only
IBD
false
2
1
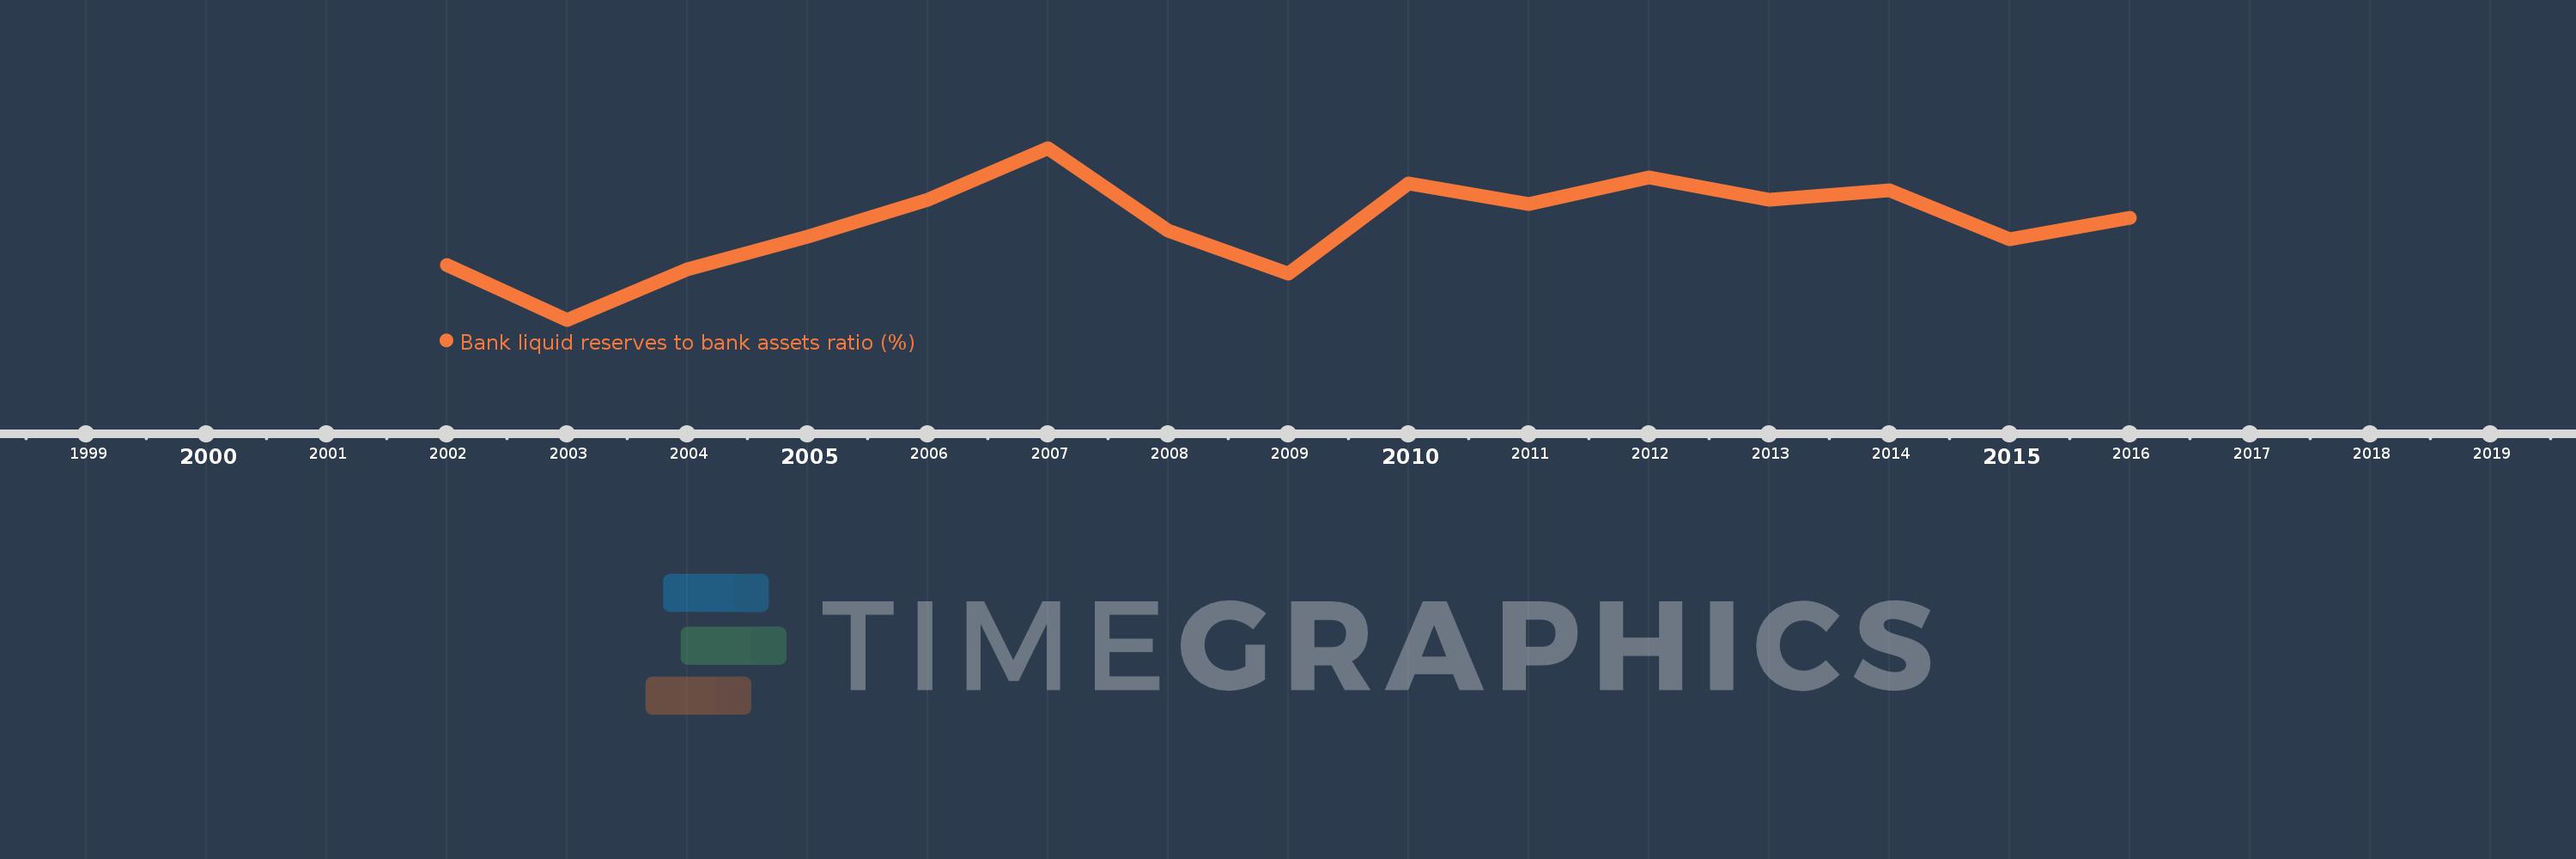
Bank liquid reserves to bank assets ratio (%)
2016,2015,2014,2013,2012,2011,2010,2009,2008,2007,2006,2005,2004,2003,2002
This statistics in other country:
Timeline:
This timeline shows a graph from 2002 to 2016 of IBRD only. No data until 2001. Number of actual observations by date: 15.
Source name:
World Development Indicators
Source organization:
International Monetary Fund, International Financial Statistics and data files.
Categories, topics:
Financial Sector
Last updated:
apr 23, 2017
Indicators value changes by year
Minimum:
14.186
jan 1, 2003
At the date of observation
Value
Absolute change
Change from previous value
jan 1, 2002
16.404
+16.404
0.0%
jan 1, 2003
14.186
-2.218
-13.52%
jan 1, 2004
16.247
+2.061
14.53%
jan 1, 2005
17.559
+1.312
8.08%
jan 1, 2006
19.056
+1.497
8.52%
jan 1, 2007
21.15
+2.094
10.99%
jan 1, 2008
17.807
-3.343
-15.81%
jan 1, 2009
16.062
-1.744
-9.8%
jan 1, 2010
19.697
+3.635
22.63%
jan 1, 2011
18.868
-0.829
-4.21%
jan 1, 2012
19.94
+1.072
5.68%
jan 1, 2013
19.036
-0.904
-4.53%
jan 1, 2014
19.437
+0.401
2.11%
jan 1, 2015
17.436
-2.001
-10.3%
jan 1, 2016
18.321
+0.885
5.08%
Ranking of countries by current statistics by years


Comments: