29
/
en
AIzaSyAYiBZKx7MnpbEhh9jyipgxe19OcubqV5w
April 1, 2024
268992
Turkey
TUR
true
2
1
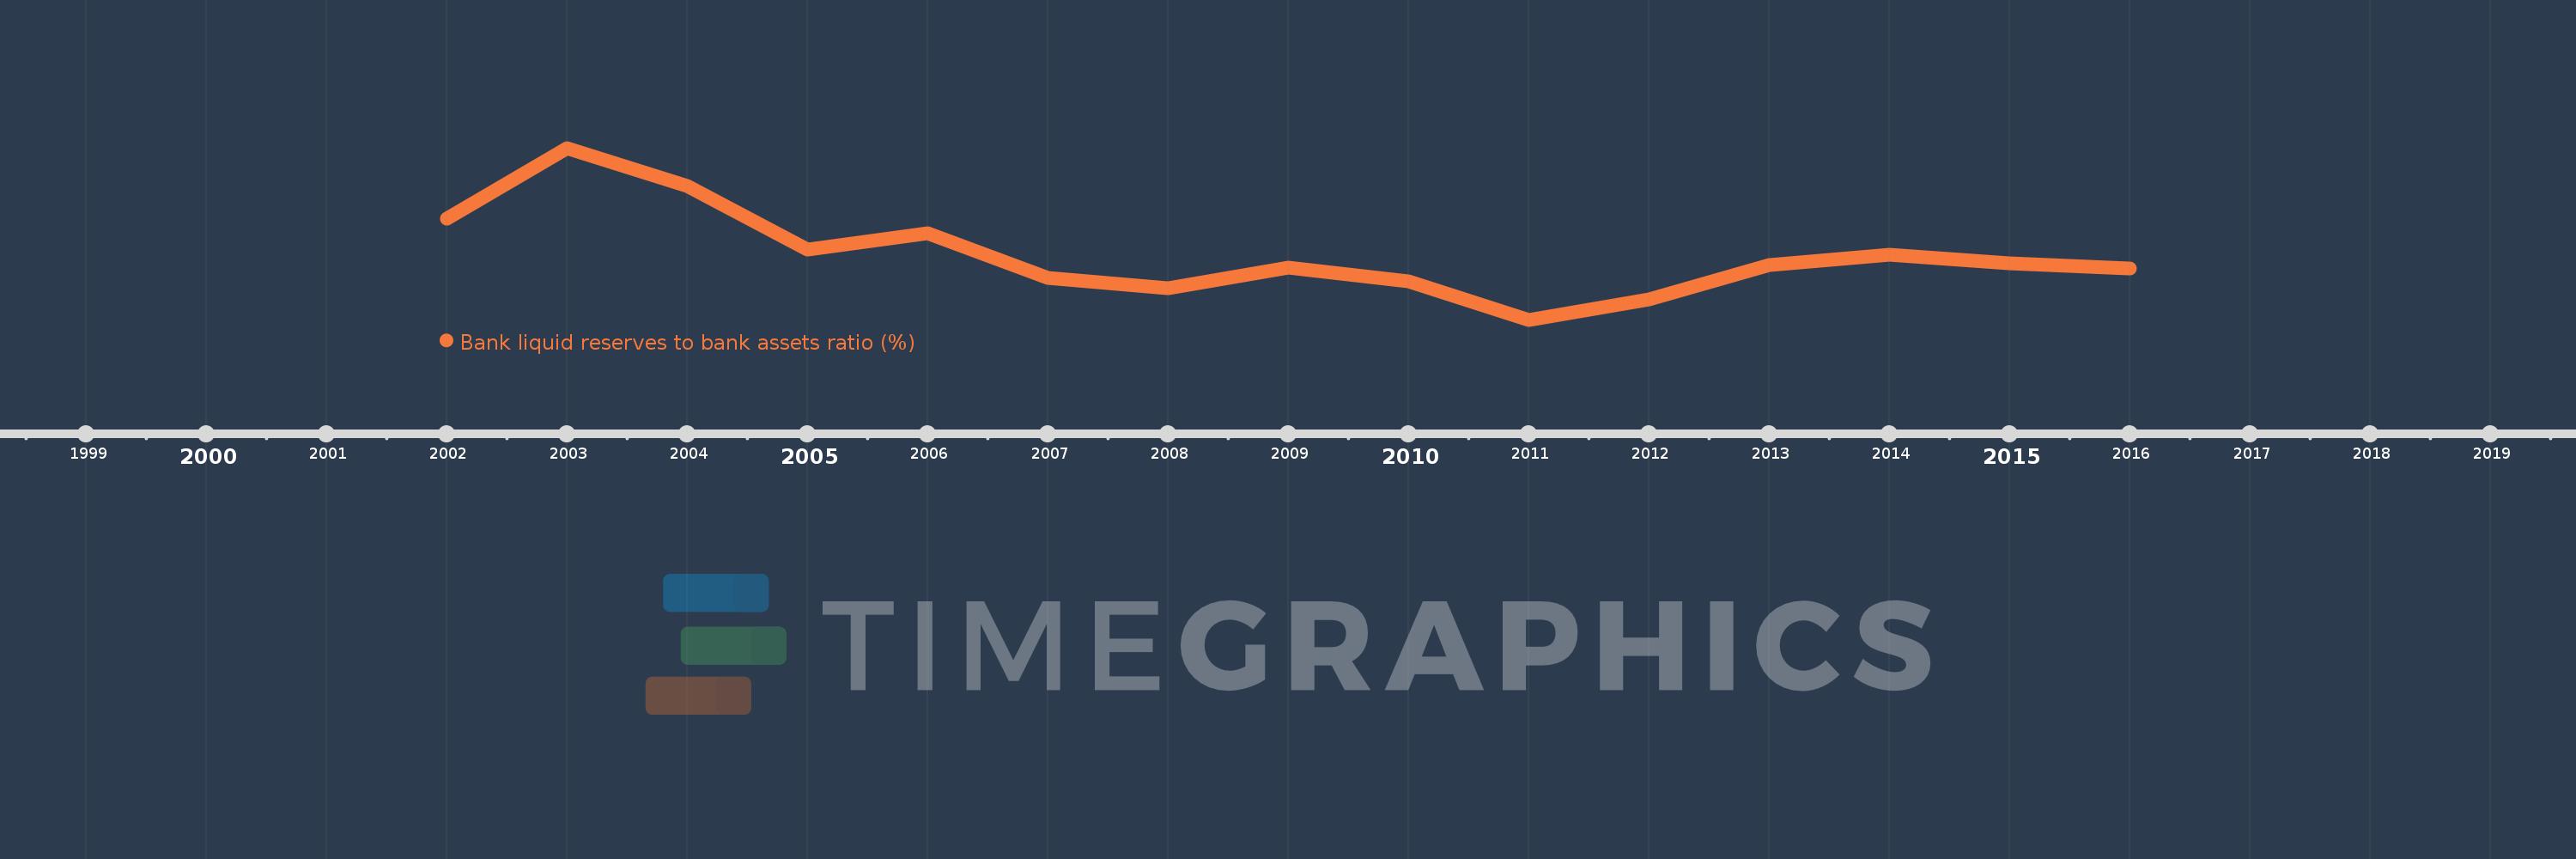
Bank liquid reserves to bank assets ratio (%)
2016,2015,2014,2013,2012,2011,2010,2009,2008,2007,2006,2005,2004,2003,2002
This statistics in other country:
Timeline:
This timeline shows a graph from 2002 to 2016 of Turkey. No data until 2001. Number of actual observations by date: 15.
Source name:
World Development Indicators
Source organization:
International Monetary Fund, International Financial Statistics and data files.
Categories, topics:
Financial Sector
Last updated:
apr 23, 2017
Indicators value changes by year
Minimum:
10.908
jan 1, 2011
Maximum:
27.118
jan 1, 2003
At the date of observation
Value
Absolute change
Change from previous value
jan 1, 2002
20.442
+20.442
0.0%
jan 1, 2003
27.118
+6.676
32.66%
jan 1, 2004
23.518
-3.599
-13.27%
jan 1, 2005
17.559
-5.96
-25.34%
jan 1, 2006
19.056
+1.497
8.52%
jan 1, 2007
14.84
-4.215
-22.12%
jan 1, 2008
13.905
-0.935
-6.3%
jan 1, 2009
15.863
+1.958
14.08%
jan 1, 2010
14.52
-1.342
-8.46%
jan 1, 2011
10.908
-3.612
-24.87%
jan 1, 2012
12.853
+1.944
17.82%
jan 1, 2013
16.058
+3.205
24.94%
jan 1, 2014
17.082
+1.024
6.38%
jan 1, 2015
16.236
-0.846
-4.95%
jan 1, 2016
15.765
-0.472
-2.9%
Ranking of countries by current statistics by years


Comments: