29
/
en
AIzaSyAYiBZKx7MnpbEhh9jyipgxe19OcubqV5w
April 1, 2024
189916
Mali
MLI
true
2
1
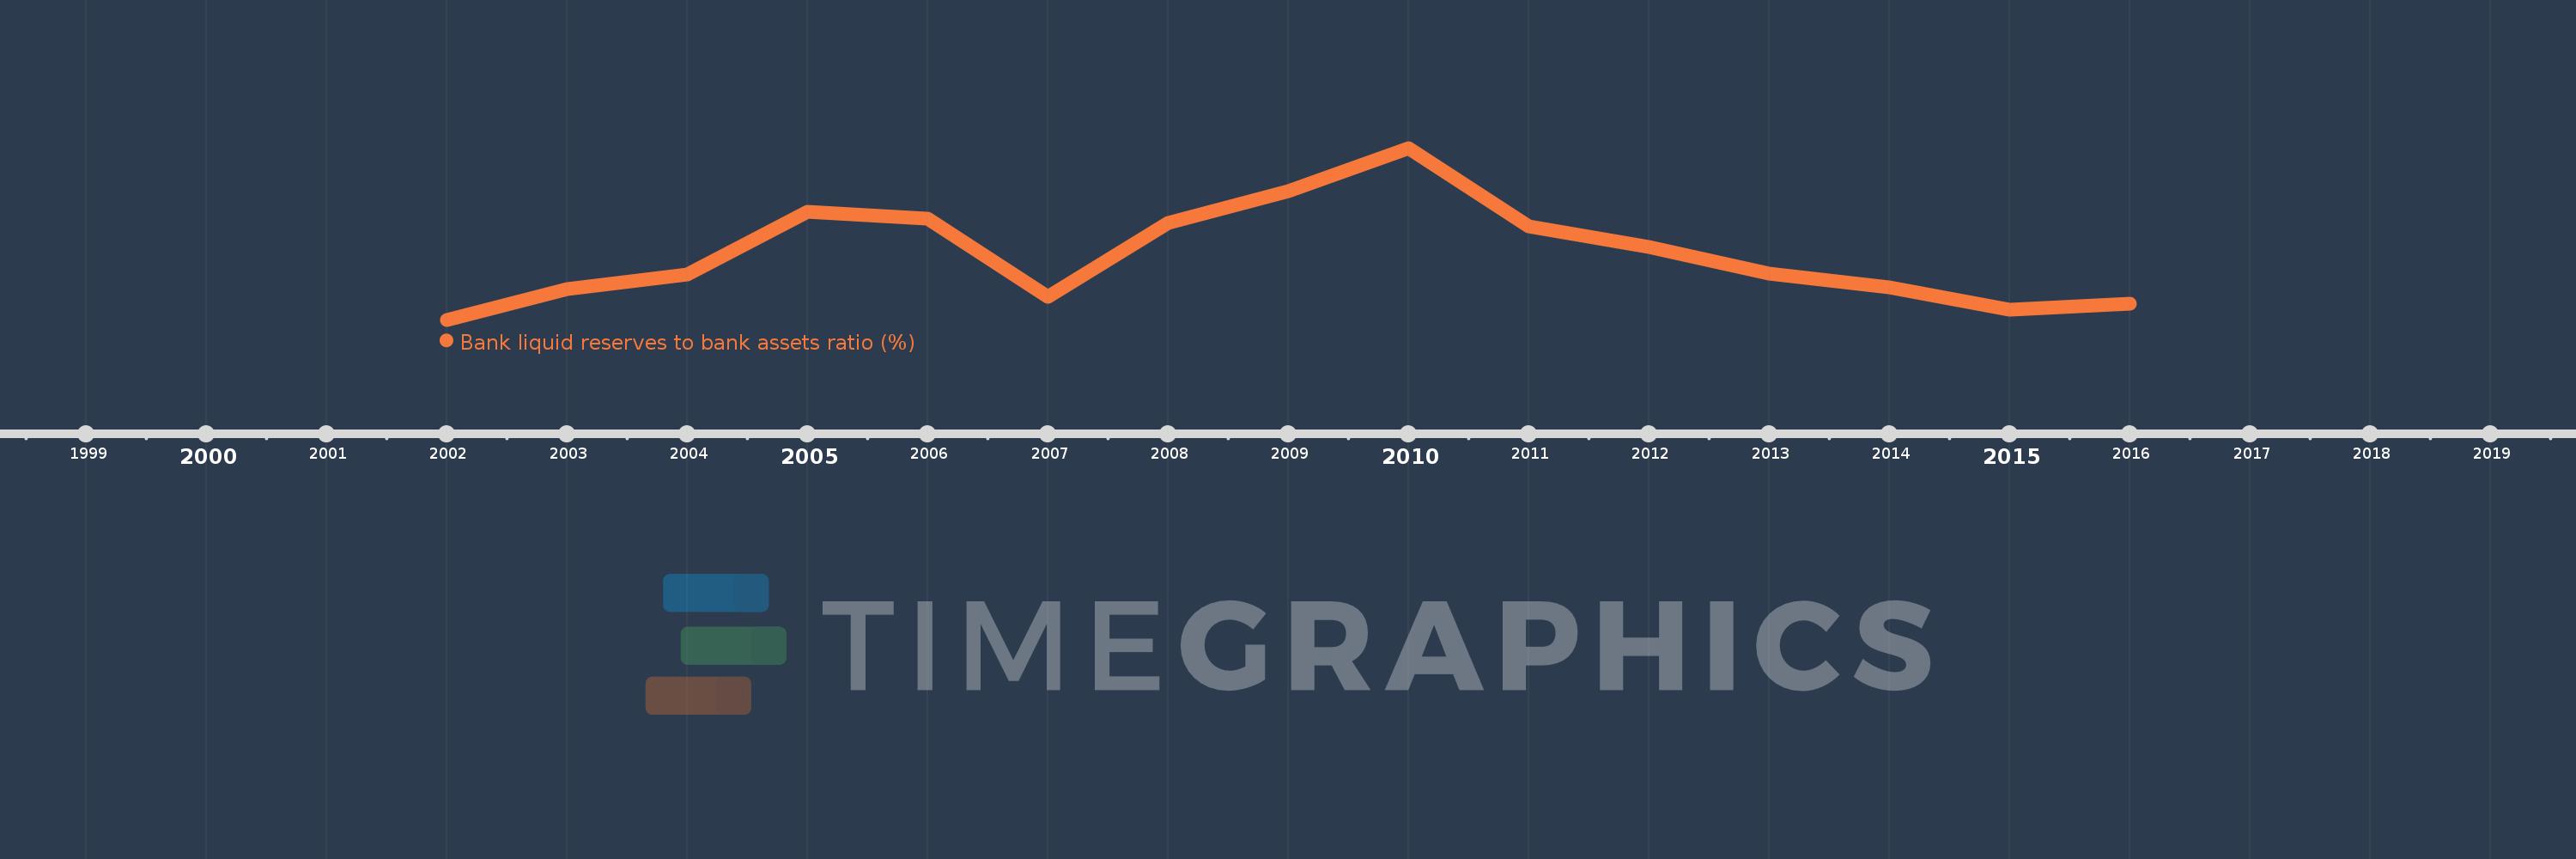
Bank liquid reserves to bank assets ratio (%)
2016,2015,2014,2013,2012,2011,2010,2009,2008,2007,2006,2005,2004,2003,2002
This statistics in other country:
Timeline:
This timeline shows a graph from 2002 to 2016 of Mali. No data until 2001. Number of actual observations by date: 15.
Source name:
World Development Indicators
Source organization:
International Monetary Fund, International Financial Statistics and data files.
Categories, topics:
Financial Sector
Last updated:
apr 23, 2017
Indicators value changes by year
Minimum:
10.462
jan 1, 2002
Maximum:
22.703
jan 1, 2010
At the date of observation
Value
Absolute change
Change from previous value
jan 1, 2002
10.462
+10.462
0.0%
jan 1, 2003
12.664
+2.203
21.05%
jan 1, 2004
13.657
+0.993
7.84%
jan 1, 2005
18.179
+4.522
33.11%
jan 1, 2006
17.684
-0.495
-2.73%
jan 1, 2007
12.1
-5.584
-31.58%
jan 1, 2008
17.38
+5.28
43.64%
jan 1, 2009
19.62
+2.24
12.89%
jan 1, 2010
22.703
+3.082
15.71%
jan 1, 2011
17.108
-5.595
-24.64%
jan 1, 2012
15.674
-1.433
-8.38%
jan 1, 2013
13.762
-1.913
-12.2%
jan 1, 2014
12.779
-0.982
-7.14%
jan 1, 2015
11.165
-1.614
-12.63%
jan 1, 2016
11.599
+0.434
3.89%
Ranking of countries by current statistics by years


Comments: