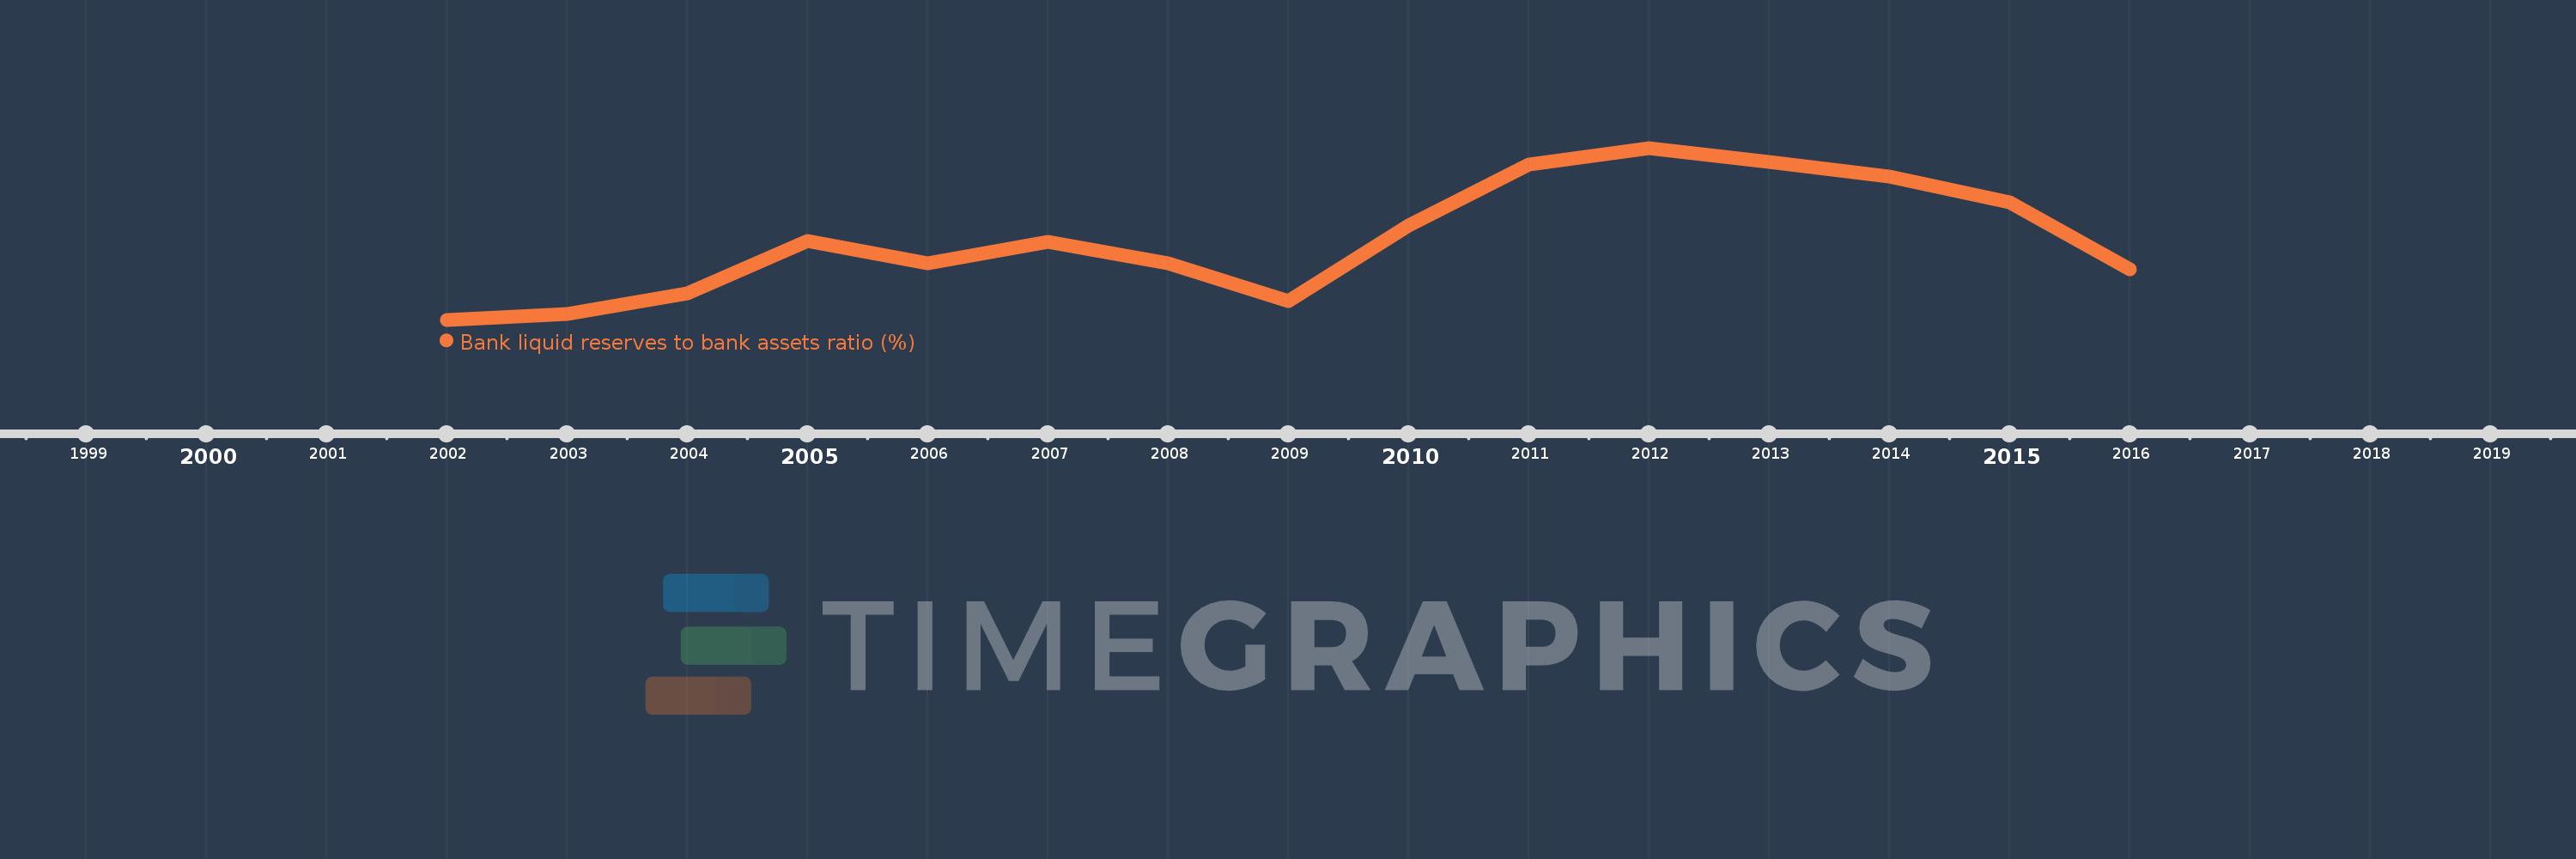
This timeline shows a graph from 2002 to 2016 of East Asia & Pacific (IDA & IBRD countries). No data until 2001. Number of actual observations by date: 15.
Source name:
World Development Indicators
Source organization:
International Monetary Fund, International Financial Statistics and data files.
Categories, topics:
Financial Sector
Last updated:
apr 23, 2017
Indicators value changes by year
Meaning:
24.065
Minimum:
16.541
jan 1, 2002
Maximum:
32.552
jan 1, 2012
At the date of observation
Value
Absolute change
Change from the previous value
jan 1, 2002
16.541
+16.541
0.0%
jan 1, 2003
17.091
+0.55
3.33%
jan 1, 2004
19.016
+1.925
11.26%
jan 1, 2005
23.898
+4.882
25.67%
jan 1, 2006
21.837
-2.06
-8.62%
jan 1, 2007
23.827
+1.99
9.11%
jan 1, 2008
21.776
-2.051
-8.61%
jan 1, 2009
18.301
-3.475
-15.96%
jan 1, 2010
25.295
+6.993
38.21%
jan 1, 2011
30.972
+5.677
22.44%
jan 1, 2012
32.552
+1.581
5.1%
jan 1, 2013
31.248
-1.304
-4.01%
jan 1, 2014
29.906
-1.343
-4.3%
jan 1, 2015
27.48
-2.426
-8.11%
jan 1, 2016
21.235
-6.245
-22.73%
Ranking of countries by current statistics by years
