29
/
en
AIzaSyAYiBZKx7MnpbEhh9jyipgxe19OcubqV5w
April 1, 2024
201265
Morocco
MAR
true
2
1
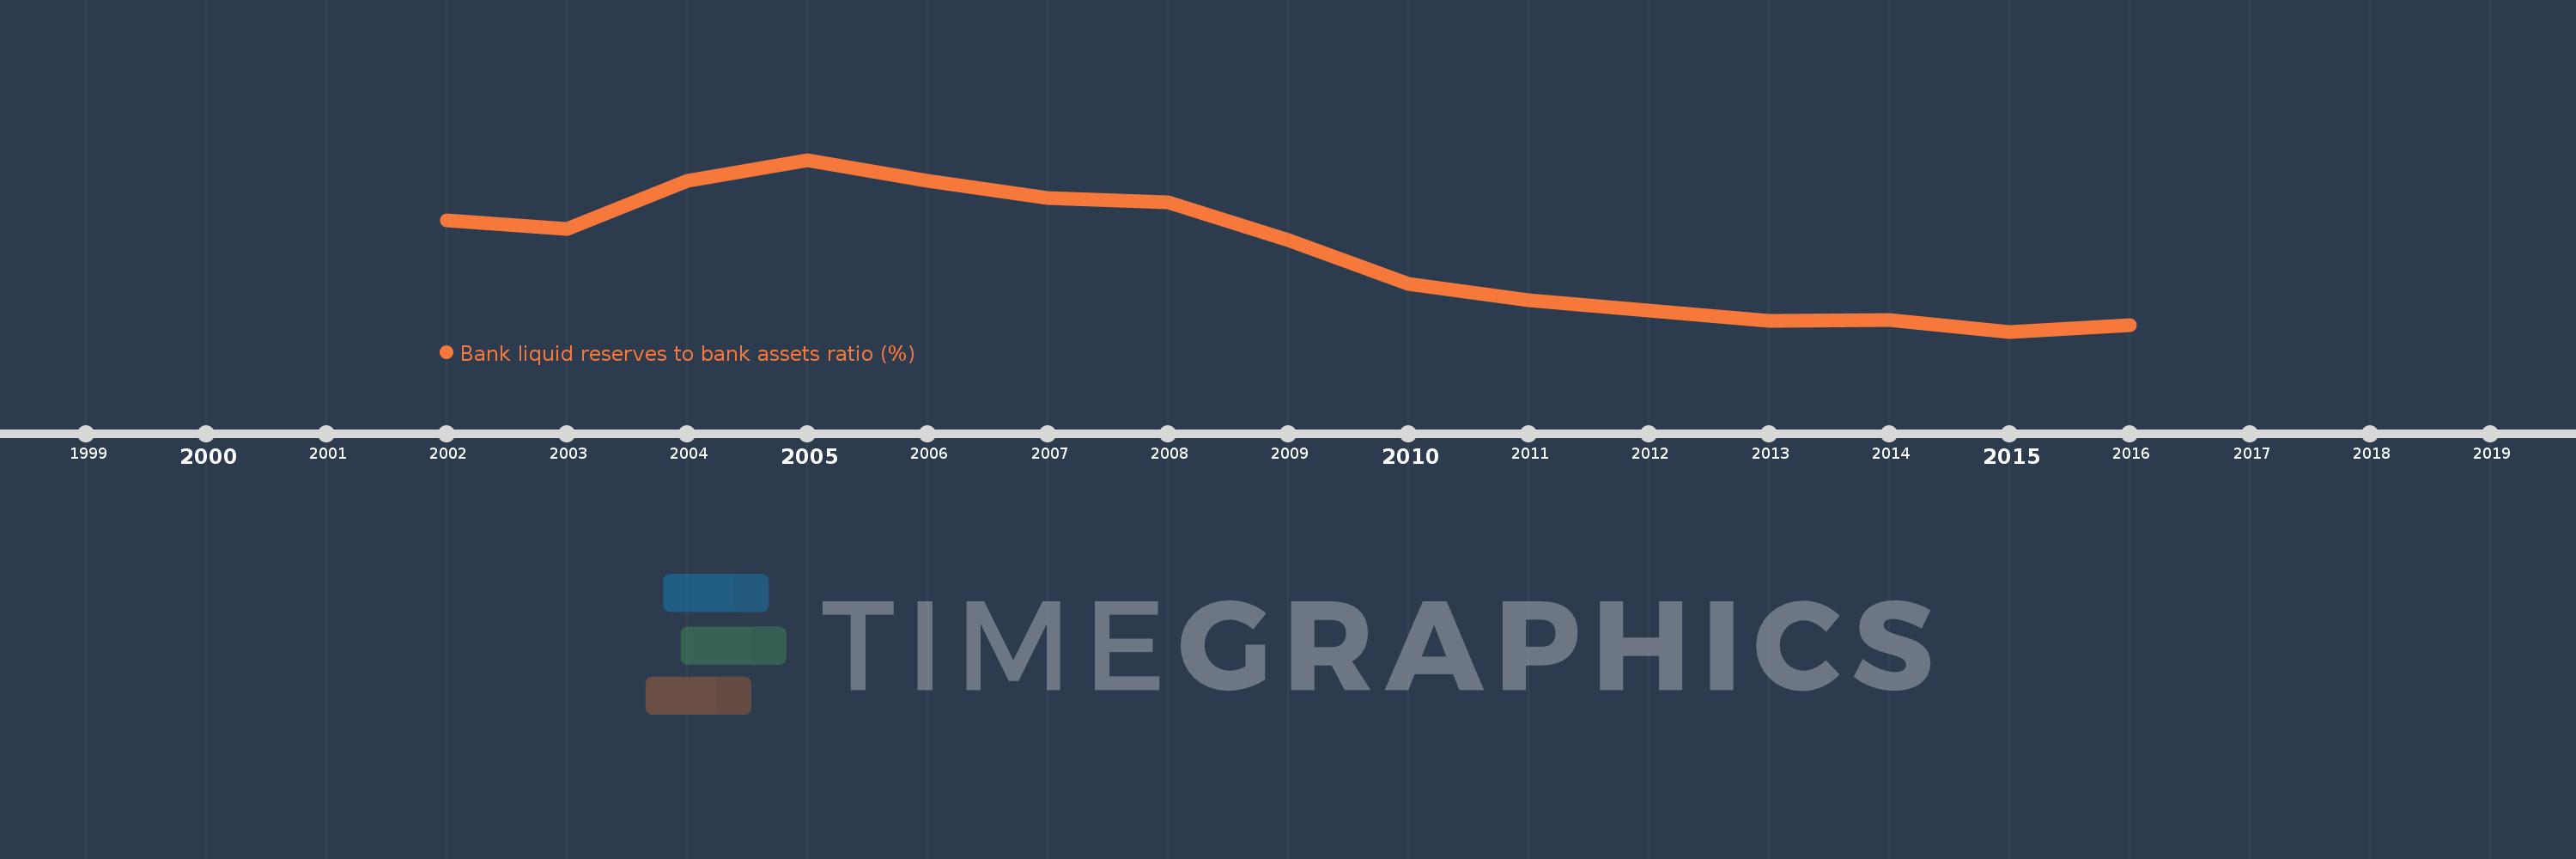
Bank liquid reserves to bank assets ratio (%)
2016,2015,2014,2013,2012,2011,2010,2009,2008,2007,2006,2005,2004,2003,2002
This statistics in other country:
Timeline:
This timeline shows a graph from 2002 to 2016 of Morocco. No data until 2001. Number of actual observations by date: 15.
Source name:
World Development Indicators
Source organization:
International Monetary Fund, International Financial Statistics and data files.
Categories, topics:
Financial Sector
Last updated:
apr 23, 2017
Indicators value changes by year
Maximum:
16.963
jan 1, 2005
At the date of observation
Value
Absolute change
Change from previous value
jan 1, 2002
11.799
+11.799
0.0%
jan 1, 2003
11.014
-0.785
-6.66%
jan 1, 2004
15.174
+4.16
37.77%
jan 1, 2005
16.963
+1.788
11.79%
jan 1, 2006
15.154
-1.809
-10.66%
jan 1, 2007
13.682
-1.472
-9.71%
jan 1, 2008
13.344
-0.338
-2.47%
jan 1, 2009
10.09
-3.254
-24.38%
jan 1, 2010
6.373
-3.717
-36.84%
jan 1, 2011
4.97
-1.402
-22.01%
jan 1, 2012
4.072
-0.898
-18.07%
jan 1, 2013
3.191
-0.881
-21.64%
jan 1, 2014
3.281
+0.091
2.84%
jan 1, 2015
2.259
-1.022
-31.15%
jan 1, 2016
2.776
+0.517
22.87%
Ranking of countries by current statistics by years


Comments: