29
/
en
AIzaSyAYiBZKx7MnpbEhh9jyipgxe19OcubqV5w
April 1, 2024
228150
Romania
ROU
true
2
1
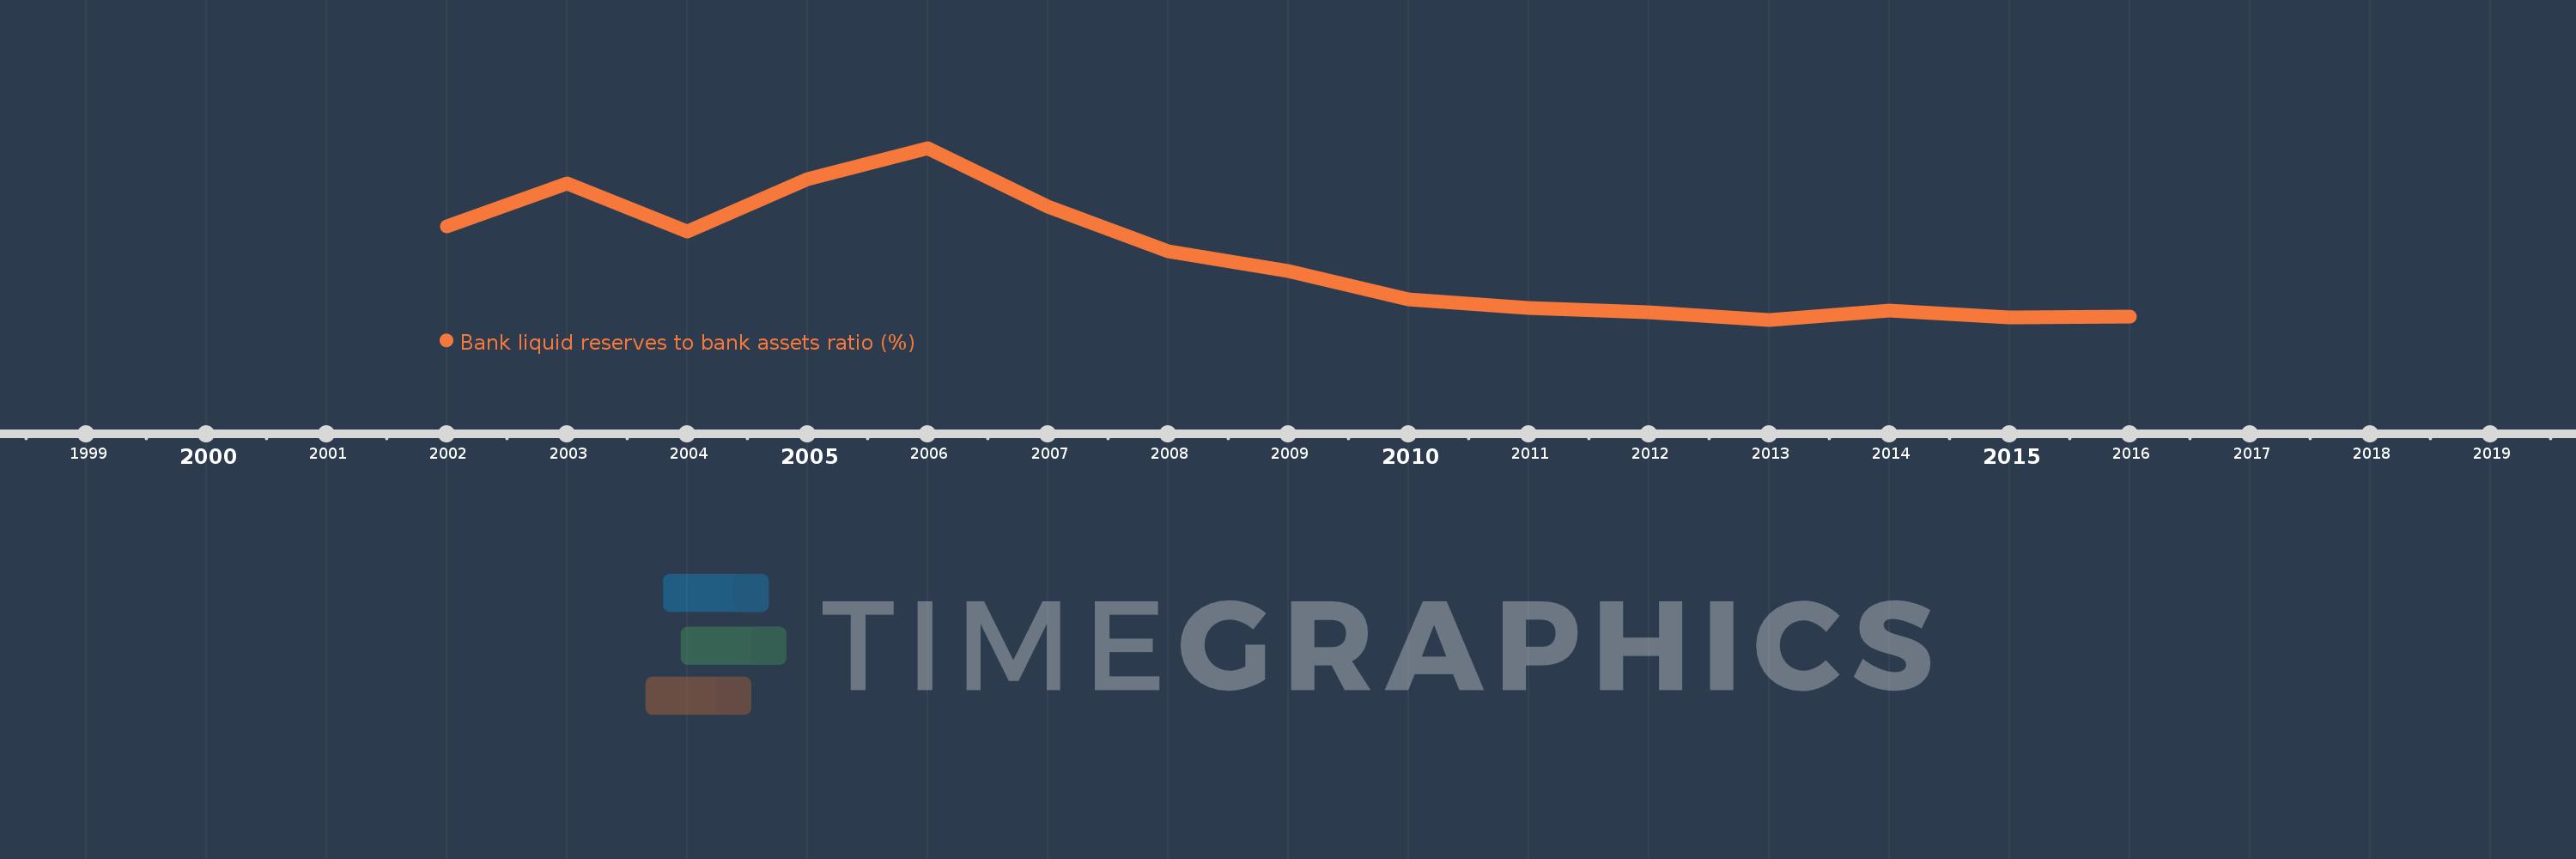
Bank liquid reserves to bank assets ratio (%)
2016,2015,2014,2013,2012,2011,2010,2009,2008,2007,2006,2005,2004,2003,2002
This statistics in other country:
Timeline:
This timeline shows a graph from 2002 to 2016 of Romania. No data until 2001. Number of actual observations by date: 15.
Source name:
World Development Indicators
Source organization:
International Monetary Fund, International Financial Statistics and data files.
Categories, topics:
Financial Sector
Last updated:
apr 23, 2017
Indicators value changes by year
Minimum:
21.129
jan 1, 2013
Maximum:
77.207
jan 1, 2006
At the date of observation
Value
Absolute change
Change from previous value
jan 1, 2002
51.486
+51.486
0.0%
jan 1, 2003
65.576
+14.09
27.37%
jan 1, 2004
50.029
-15.548
-23.71%
jan 1, 2005
67.12
+17.091
34.16%
jan 1, 2006
77.207
+10.087
15.03%
jan 1, 2007
57.927
-19.279
-24.97%
jan 1, 2008
43.358
-14.569
-25.15%
jan 1, 2009
36.929
-6.43
-14.83%
jan 1, 2010
27.797
-9.132
-24.73%
jan 1, 2011
25.062
-2.735
-9.84%
jan 1, 2012
23.625
-1.437
-5.73%
jan 1, 2013
21.129
-2.496
-10.56%
jan 1, 2014
24.097
+2.967
14.04%
jan 1, 2015
21.978
-2.119
-8.79%
jan 1, 2016
22.1
+0.122
0.56%
Ranking of countries by current statistics by years


Comments: