29
/
en
AIzaSyAYiBZKx7MnpbEhh9jyipgxe19OcubqV5w
April 1, 2024
251655
St. Vincent and the Grenadines
VCT
true
2
1
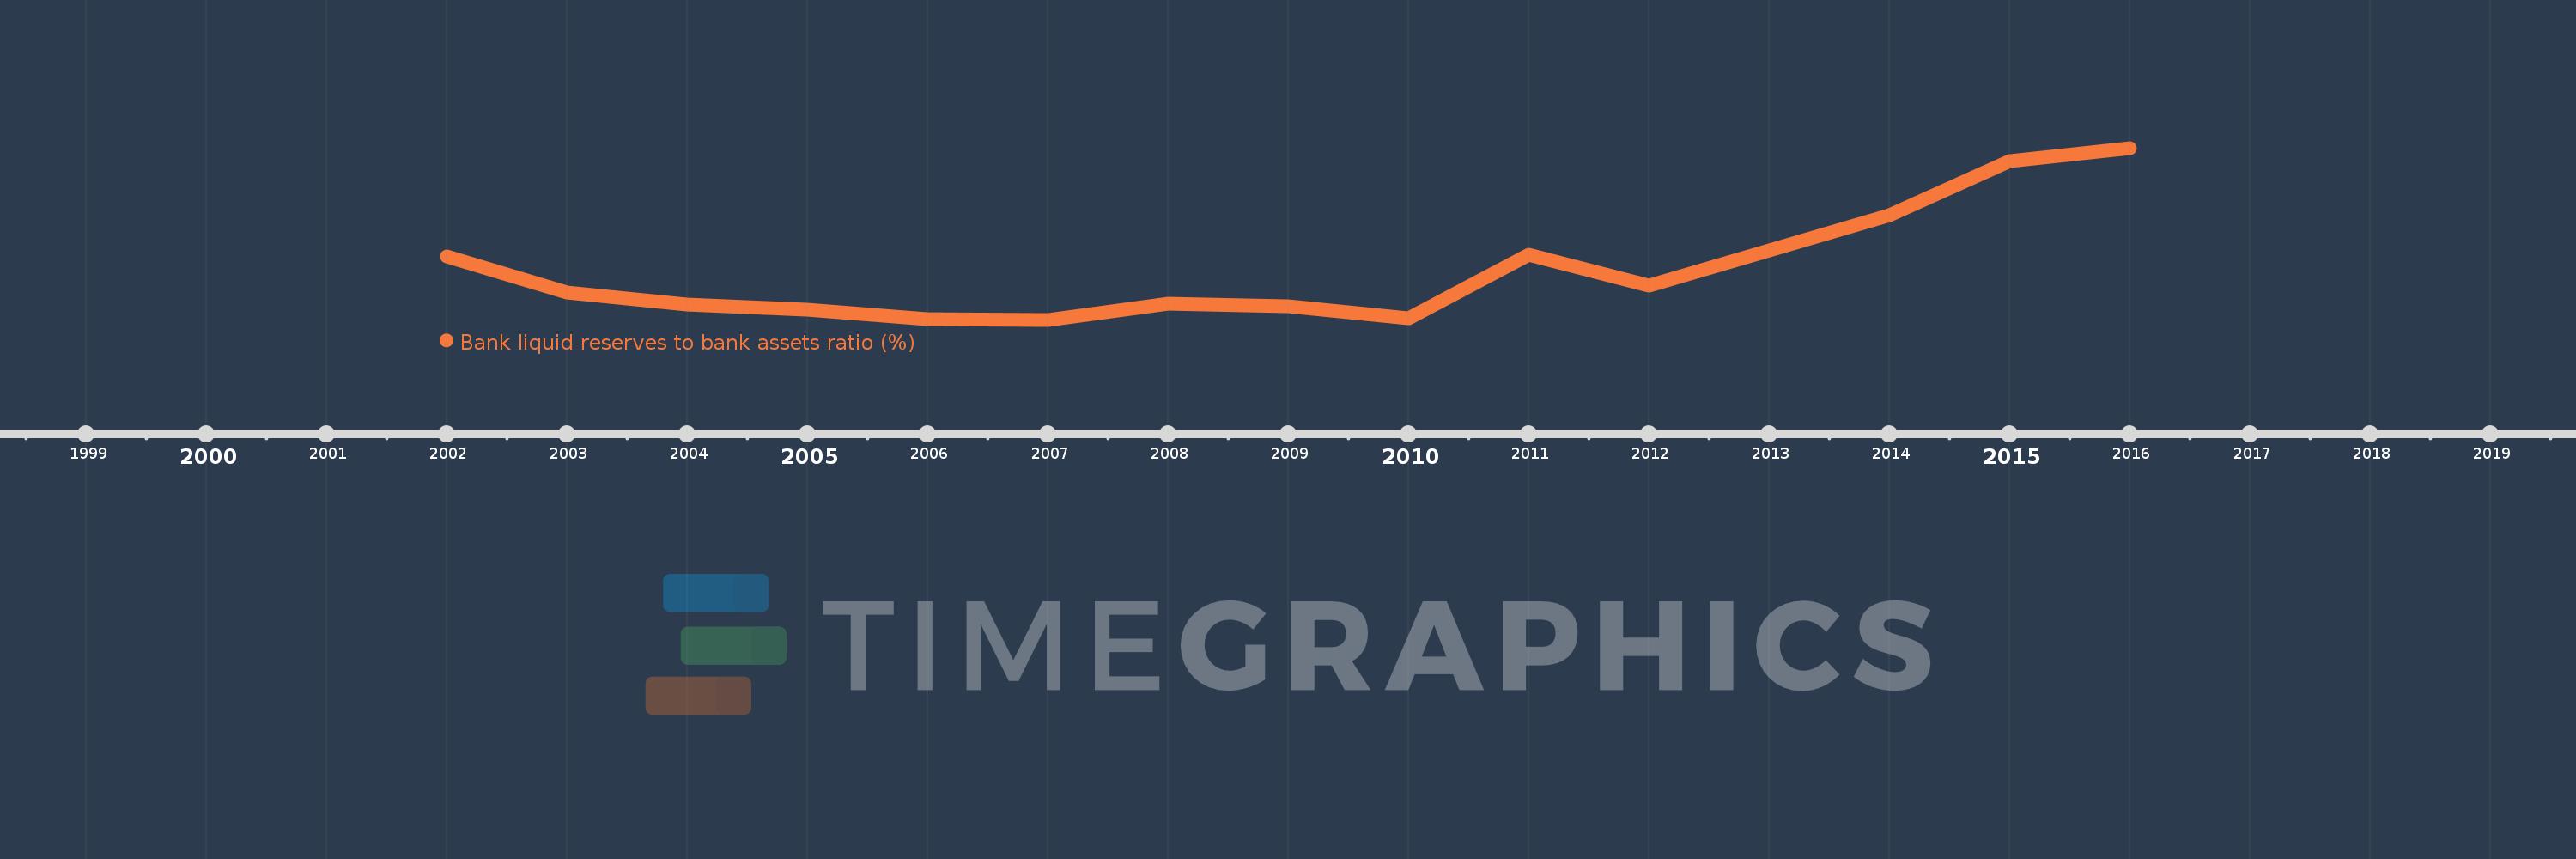
Bank liquid reserves to bank assets ratio (%)
2016,2015,2014,2013,2012,2011,2010,2009,2008,2007,2006,2005,2004,2003,2002
This statistics in other country:
Timeline:
This timeline shows a graph from 2002 to 2016 of St. Vincent and the Grenadines. No data until 2001. Number of actual observations by date: 15.
Source name:
World Development Indicators
Source organization:
International Monetary Fund, International Financial Statistics and data files.
Categories, topics:
Financial Sector
Last updated:
apr 23, 2017
Indicators value changes by year
Maximum:
27.325
jan 1, 2016
At the date of observation
Value
Absolute change
Change from previous value
jan 1, 2002
15.053
+15.053
0.0%
jan 1, 2003
10.962
-4.091
-27.18%
jan 1, 2004
9.586
-1.376
-12.55%
jan 1, 2005
8.979
-0.607
-6.33%
jan 1, 2006
7.956
-1.023
-11.39%
jan 1, 2007
7.886
-0.07
-0.88%
jan 1, 2008
9.667
+1.781
22.59%
jan 1, 2009
9.441
-0.226
-2.34%
jan 1, 2010
8.007
-1.434
-15.19%
jan 1, 2011
15.281
+7.273
90.84%
jan 1, 2012
11.789
-3.492
-22.85%
jan 1, 2013
15.705
+3.916
33.22%
jan 1, 2014
19.756
+4.051
25.79%
jan 1, 2015
25.878
+6.122
30.99%
jan 1, 2016
27.325
+1.447
5.59%
Ranking of countries by current statistics by years


Comments: