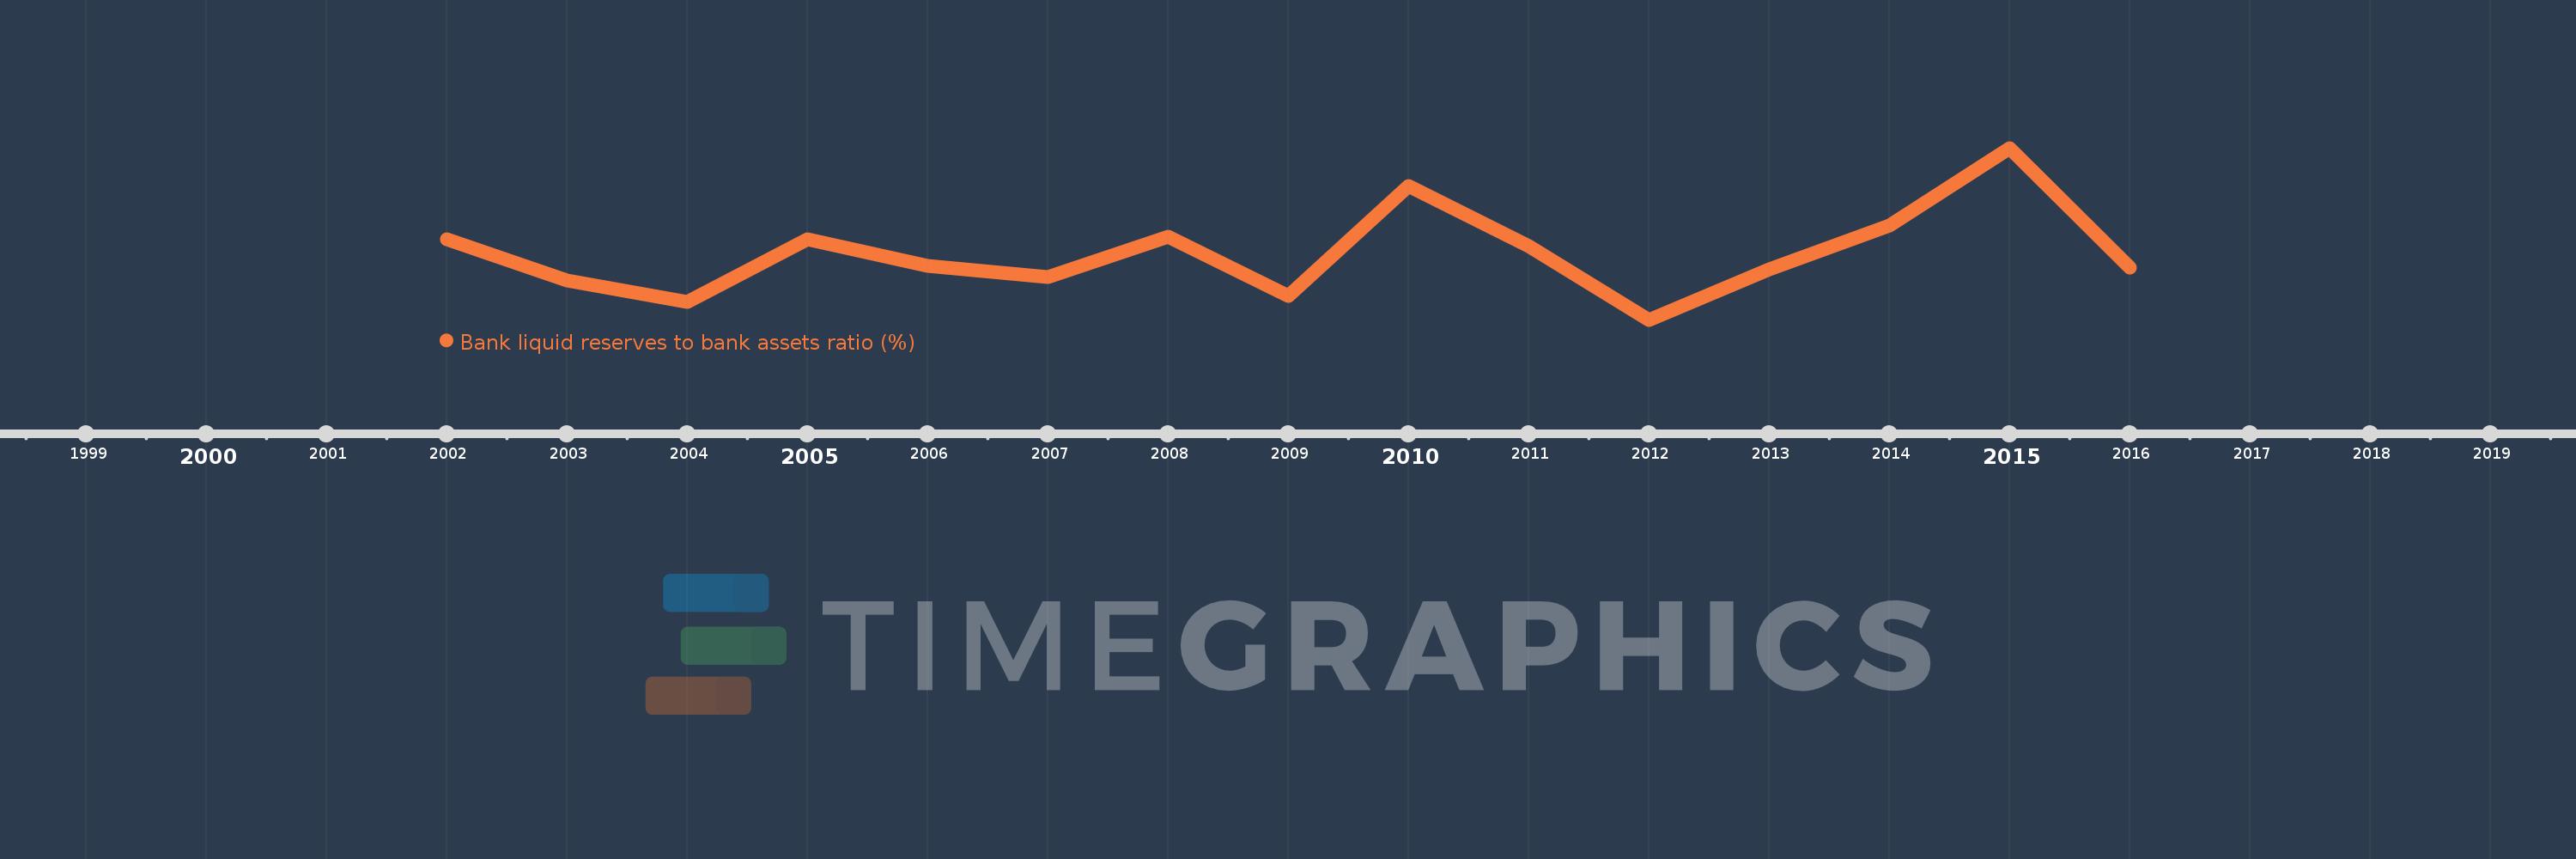
This timeline shows a graph from 2002 to 2016 of Least developed countries: UN classification. No data until 2001. Number of actual observations by date: 15.
Source name:
World Development Indicators
Source organization:
International Monetary Fund, International Financial Statistics and data files.
Categories, topics:
Financial Sector
Last updated:
apr 23, 2017
Indicators value changes by year
Meaning:
19.953
Minimum:
17.152
jan 1, 2012
Maximum:
24.392
jan 1, 2015
At the date of observation
Value
Absolute change
Change from the previous value
jan 1, 2002
20.538
+20.538
0.0%
jan 1, 2003
18.789
-1.749
-8.51%
jan 1, 2004
17.901
-0.888
-4.73%
jan 1, 2005
20.547
+2.646
14.78%
jan 1, 2006
19.432
-1.115
-5.42%
jan 1, 2007
18.953
-0.479
-2.47%
jan 1, 2008
20.64
+1.686
8.9%
jan 1, 2009
18.148
-2.492
-12.07%
jan 1, 2010
22.782
+4.634
25.53%
jan 1, 2011
20.264
-2.518
-11.05%
jan 1, 2012
17.152
-3.112
-15.36%
jan 1, 2013
19.272
+2.12
12.36%
jan 1, 2014
21.133
+1.86
9.65%
jan 1, 2015
24.392
+3.259
15.42%
jan 1, 2016
19.353
-5.04
-20.66%
Ranking of countries by current statistics by years
