29
/
en
AIzaSyAYiBZKx7MnpbEhh9jyipgxe19OcubqV5w
April 1, 2024
204976
Namibia
NAM
true
2
1
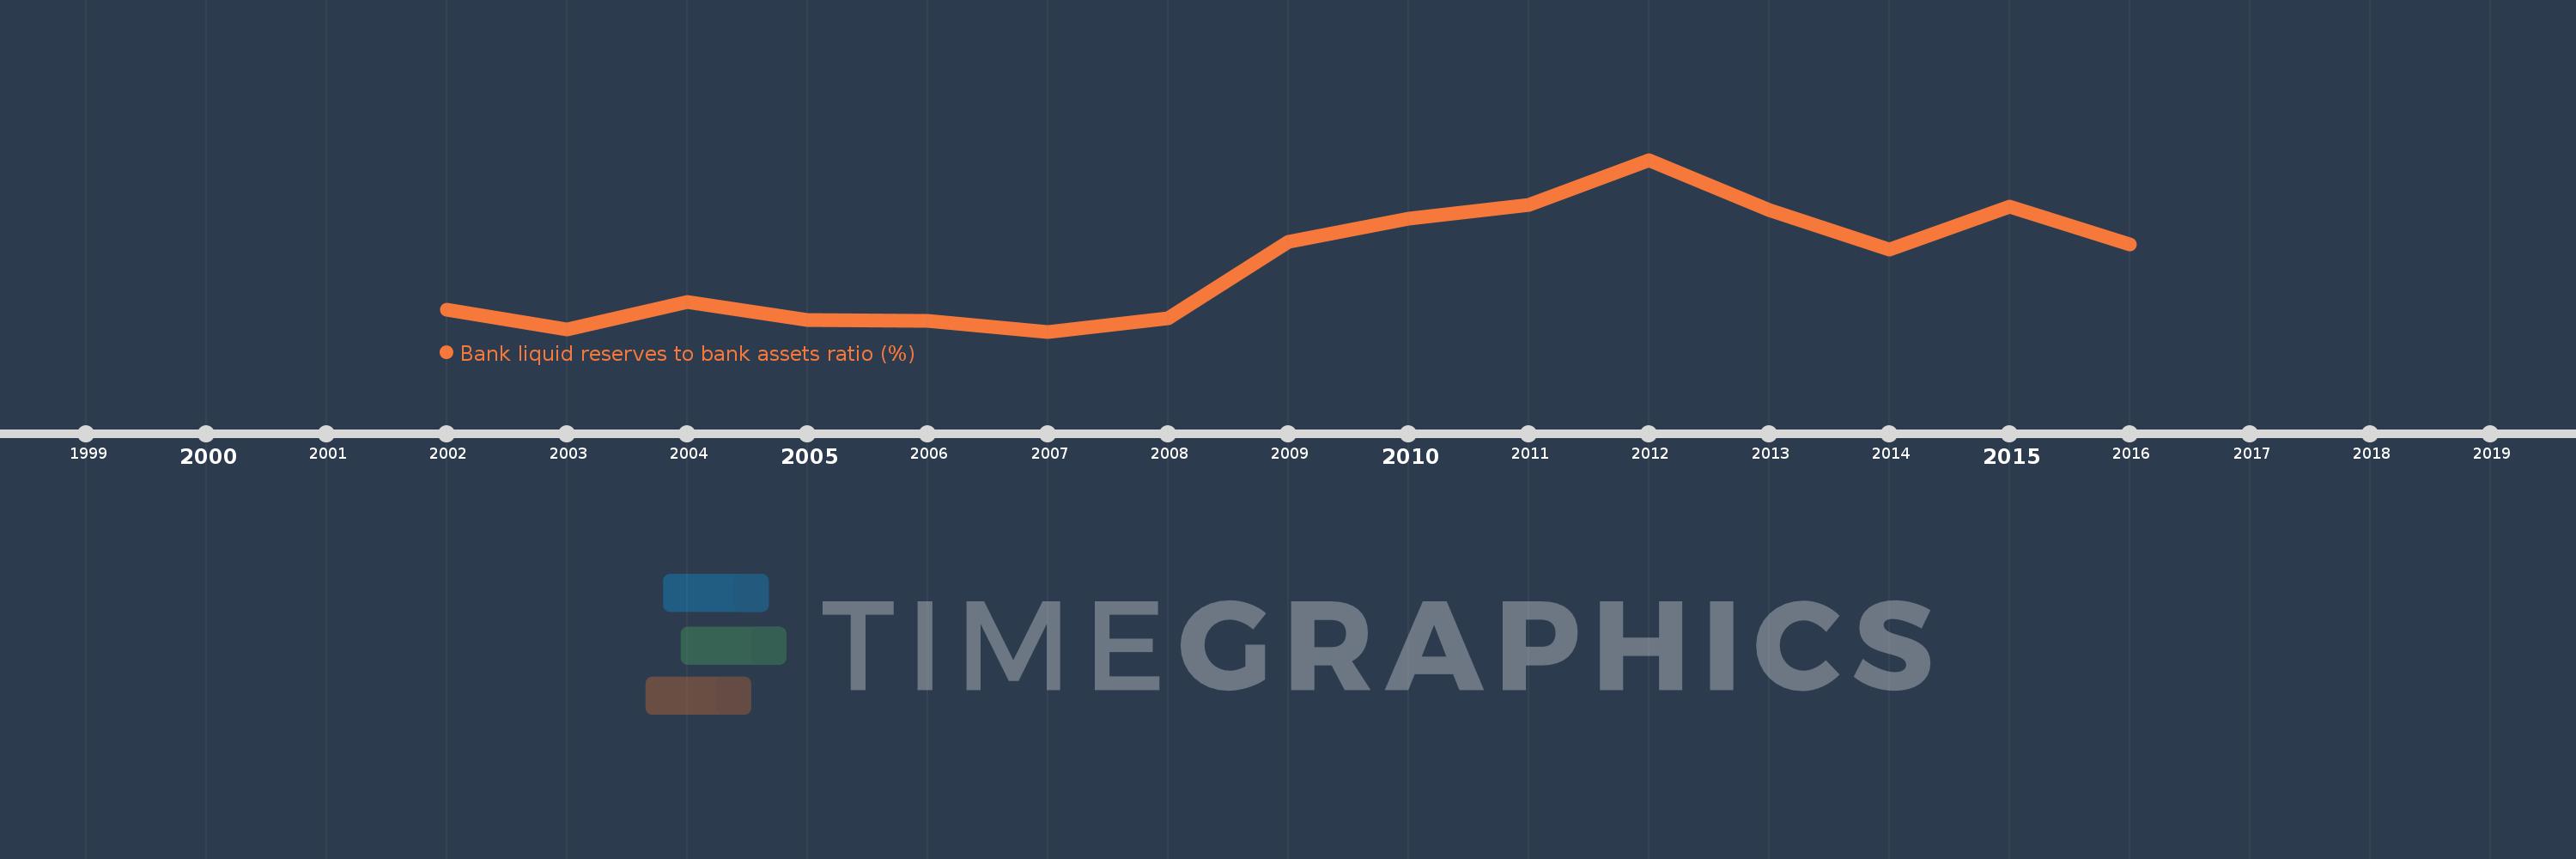
Bank liquid reserves to bank assets ratio (%)
2016,2015,2014,2013,2012,2011,2010,2009,2008,2007,2006,2005,2004,2003,2002
This statistics in other country:
Timeline:
This timeline shows a graph from 2002 to 2016 of Namibia. No data until 2001. Number of actual observations by date: 15.
Source name:
World Development Indicators
Source organization:
International Monetary Fund, International Financial Statistics and data files.
Categories, topics:
Financial Sector
Last updated:
apr 23, 2017
Indicators value changes by year
At the date of observation
Value
Absolute change
Change from previous value
jan 1, 2002
3.067
+3.067
0.0%
jan 1, 2003
2.479
-0.588
-19.18%
jan 1, 2004
3.315
+0.836
33.73%
jan 1, 2005
2.771
-0.544
-16.41%
jan 1, 2006
2.74
-0.03
-1.1%
jan 1, 2007
2.409
-0.332
-12.1%
jan 1, 2008
2.824
+0.415
17.25%
jan 1, 2009
5.136
+2.312
81.87%
jan 1, 2010
5.839
+0.702
13.67%
jan 1, 2011
6.251
+0.413
7.07%
jan 1, 2012
7.631
+1.38
22.07%
jan 1, 2013
6.111
-1.52
-19.92%
jan 1, 2014
4.903
-1.208
-19.77%
jan 1, 2015
6.219
+1.317
26.85%
jan 1, 2016
5.047
-1.172
-18.85%
Ranking of countries by current statistics by years


Comments: