29
/
en
AIzaSyAYiBZKx7MnpbEhh9jyipgxe19OcubqV5w
April 1, 2024
90812
Brazil
BRA
true
2
1
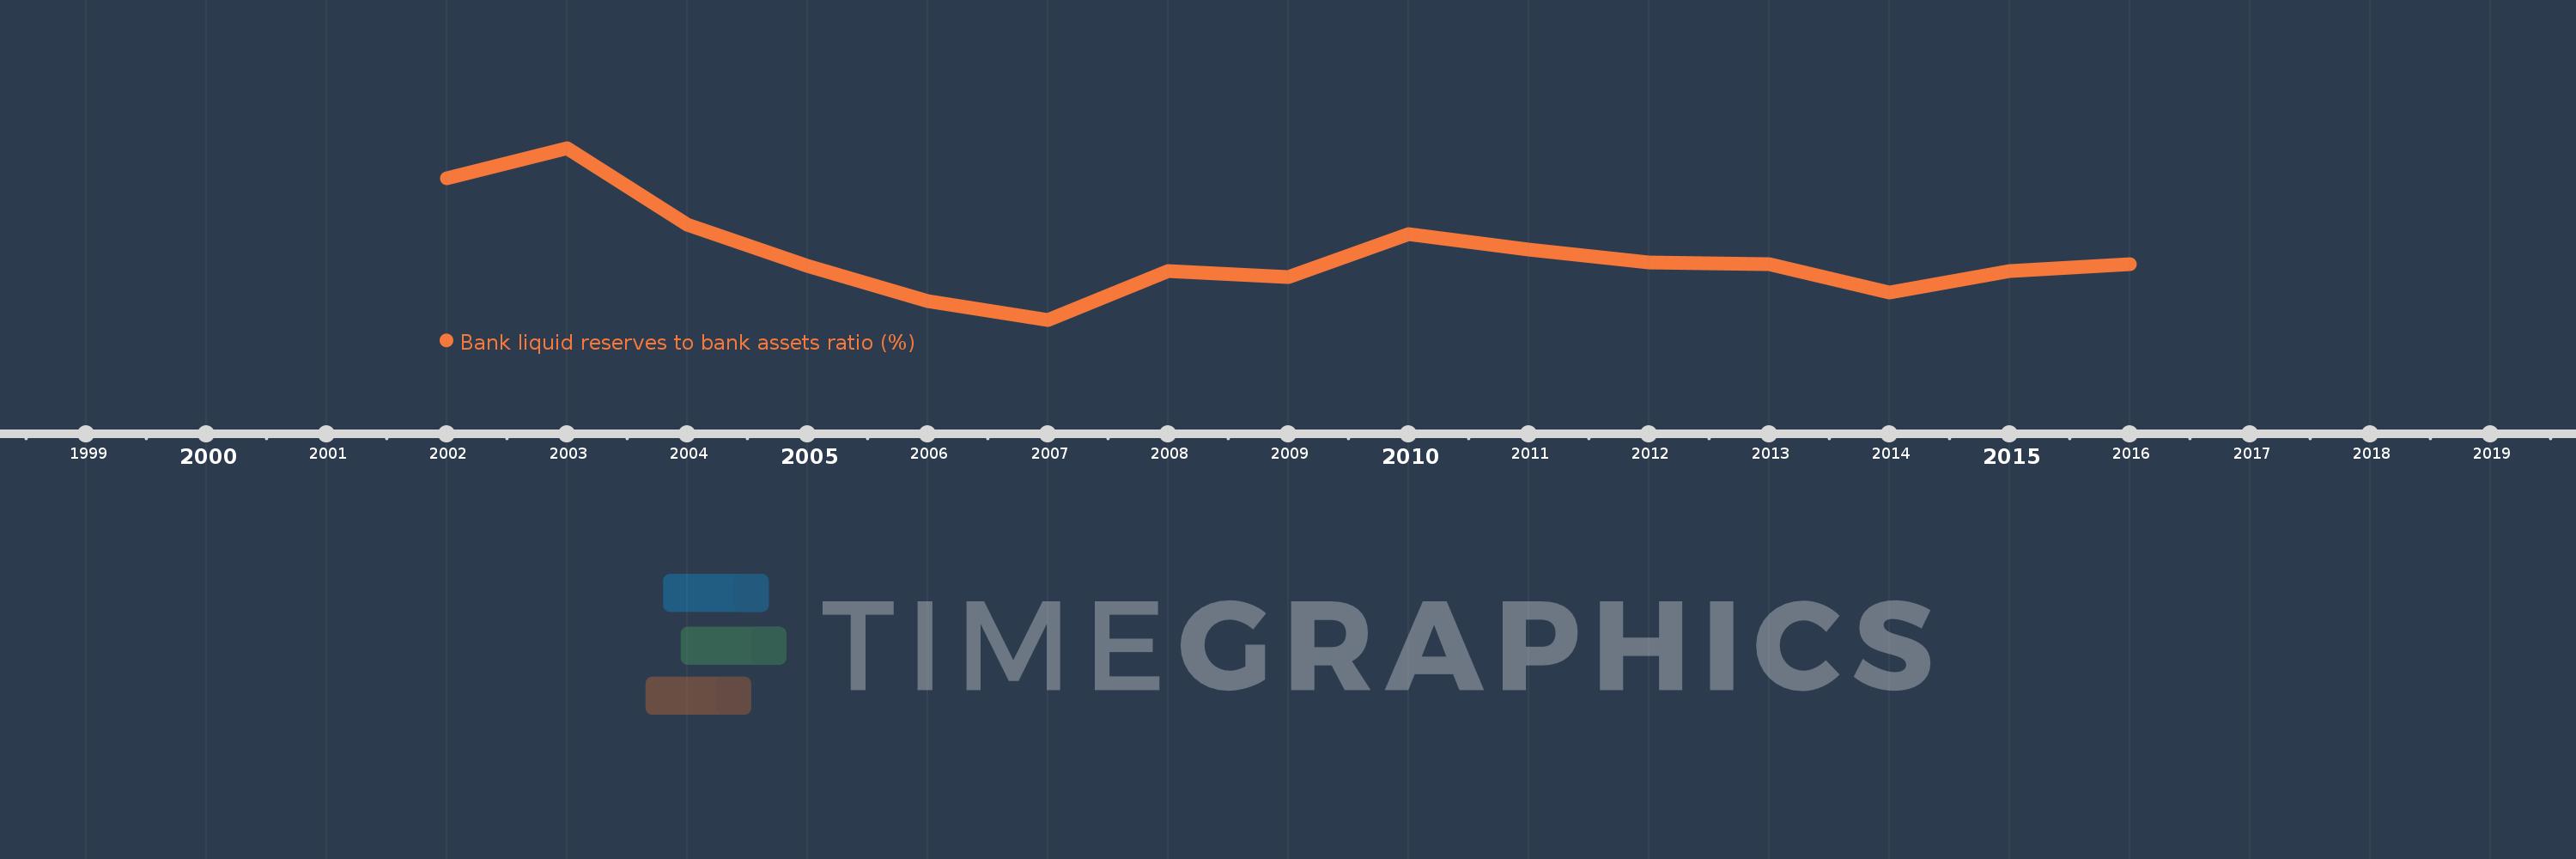
Bank liquid reserves to bank assets ratio (%)
2016,2015,2014,2013,2012,2011,2010,2009,2008,2007,2006,2005,2004,2003,2002
This statistics in other country:
Timeline:
This timeline shows a graph from 2002 to 2016 of Brazil. No data until 2001. Number of actual observations by date: 15.
Source name:
World Development Indicators
Source organization:
International Monetary Fund, International Financial Statistics and data files.
Categories, topics:
Financial Sector
Last updated:
apr 23, 2017
Indicators value changes by year
Minimum:
18.466
jan 1, 2007
Maximum:
38.888
jan 1, 2003
At the date of observation
Value
Absolute change
Change from previous value
jan 1, 2002
35.32
+35.32
0.0%
jan 1, 2003
38.888
+3.568
10.1%
jan 1, 2004
29.776
-9.112
-23.43%
jan 1, 2005
24.916
-4.86
-16.32%
jan 1, 2006
20.694
-4.221
-16.94%
jan 1, 2007
18.466
-2.229
-10.77%
jan 1, 2008
24.229
+5.763
31.21%
jan 1, 2009
23.514
-0.715
-2.95%
jan 1, 2010
28.667
+5.153
21.92%
jan 1, 2011
26.783
-1.883
-6.57%
jan 1, 2012
25.254
-1.529
-5.71%
jan 1, 2013
25.067
-0.187
-0.74%
jan 1, 2014
21.678
-3.389
-13.52%
jan 1, 2015
24.273
+2.595
11.97%
jan 1, 2016
25.091
+0.818
3.37%
Ranking of countries by current statistics by years


Comments: