29
/
en
AIzaSyAYiBZKx7MnpbEhh9jyipgxe19OcubqV5w
April 1, 2024
167146
Kenya
KEN
true
2
1
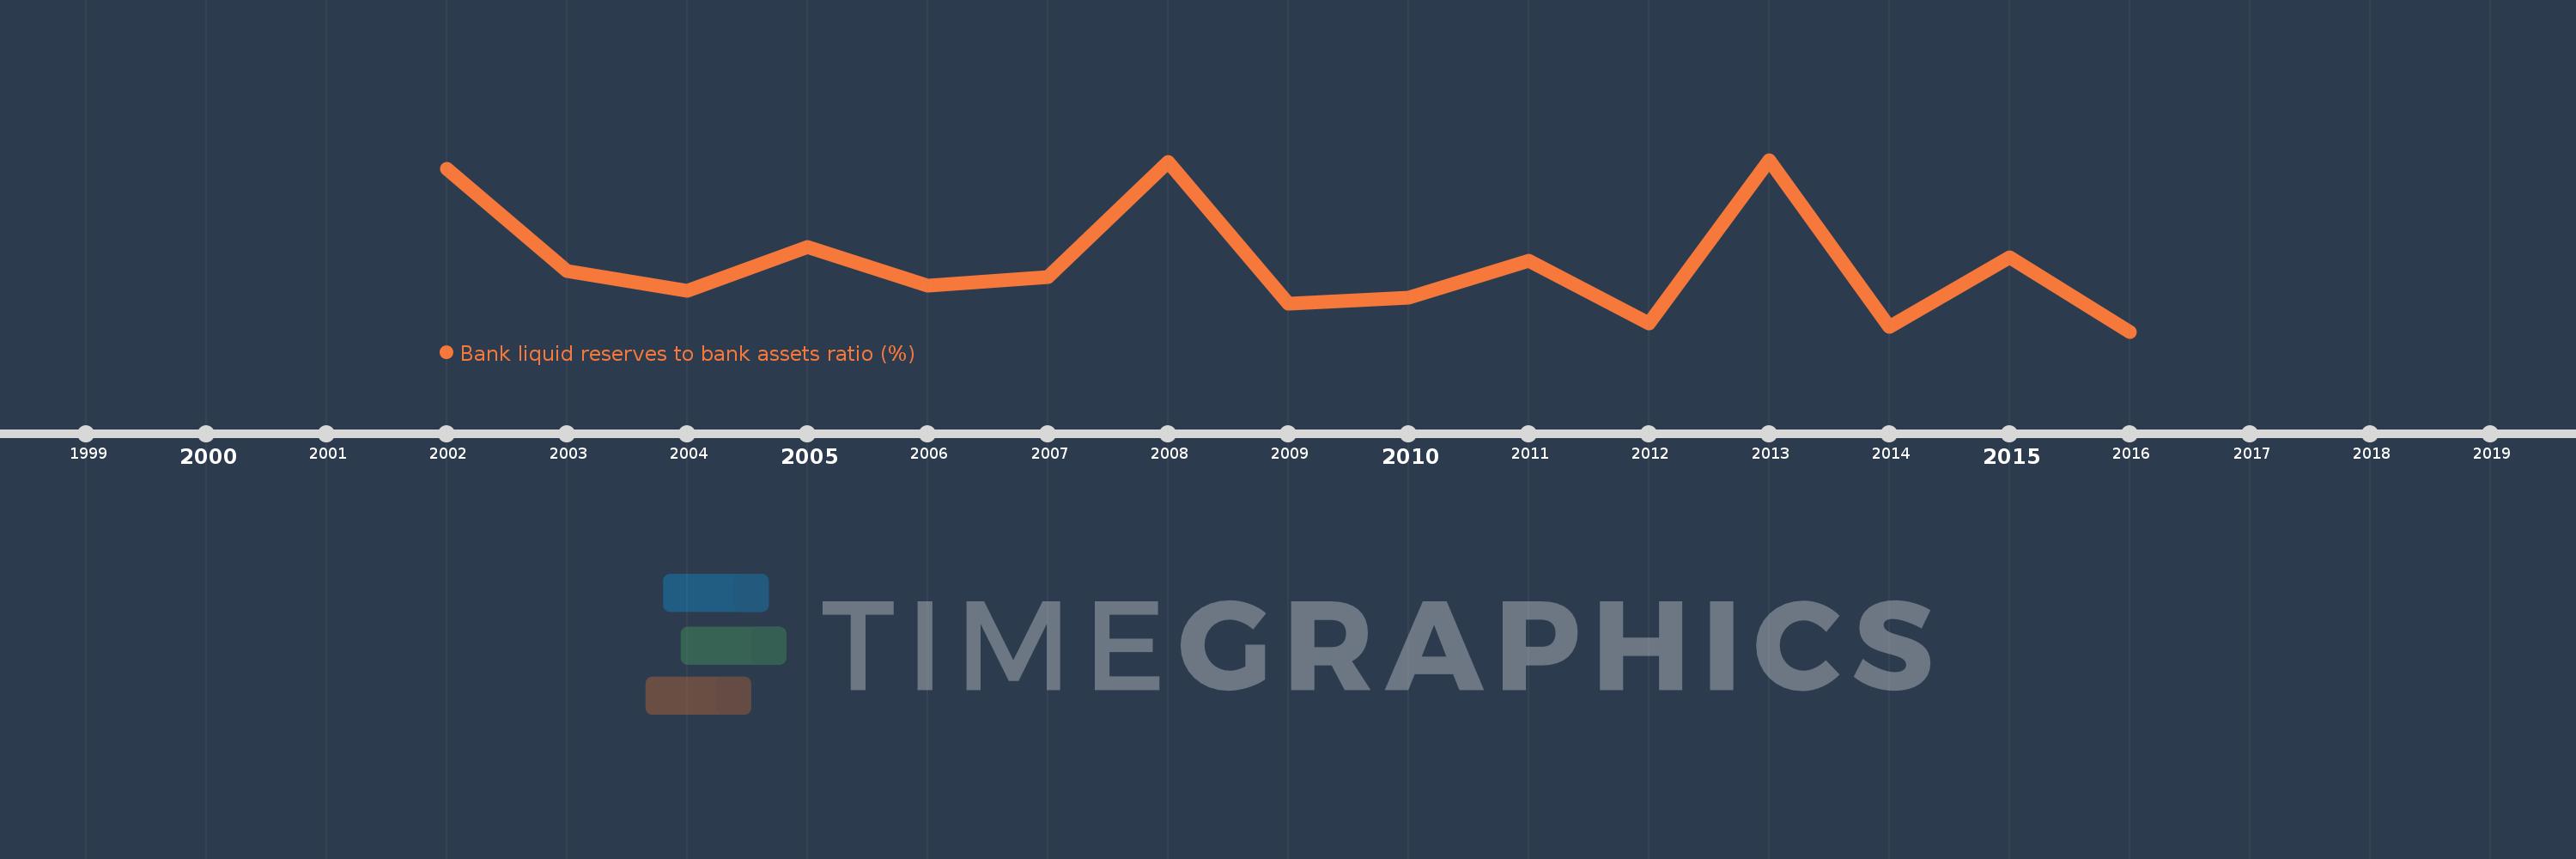
Bank liquid reserves to bank assets ratio (%)
2016,2015,2014,2013,2012,2011,2010,2009,2008,2007,2006,2005,2004,2003,2002
This statistics in other country:
Timeline:
This timeline shows a graph from 2002 to 2016 of Kenya. No data until 2001. Number of actual observations by date: 15.
Source name:
World Development Indicators
Source organization:
International Monetary Fund, International Financial Statistics and data files.
Categories, topics:
Financial Sector
Last updated:
apr 23, 2017
Indicators value changes by year
Maximum:
12.199
jan 1, 2013
At the date of observation
Value
Absolute change
Change from previous value
jan 1, 2002
12.029
+12.029
0.0%
jan 1, 2003
10.179
-1.85
-15.38%
jan 1, 2004
9.814
-0.365
-3.58%
jan 1, 2005
10.619
+0.805
8.2%
jan 1, 2006
9.915
-0.704
-6.63%
jan 1, 2007
10.067
+0.152
1.53%
jan 1, 2008
12.162
+2.095
20.81%
jan 1, 2009
9.589
-2.573
-21.16%
jan 1, 2010
9.697
+0.108
1.13%
jan 1, 2011
10.371
+0.674
6.95%
jan 1, 2012
9.231
-1.14
-10.99%
jan 1, 2013
12.199
+2.967
32.15%
jan 1, 2014
9.161
-3.038
-24.9%
jan 1, 2015
10.423
+1.262
13.78%
jan 1, 2016
9.079
-1.345
-12.9%
Ranking of countries by current statistics by years


Comments: