29
/
en
AIzaSyAYiBZKx7MnpbEhh9jyipgxe19OcubqV5w
April 1, 2024
250514
St. Lucia
LCA
true
2
1
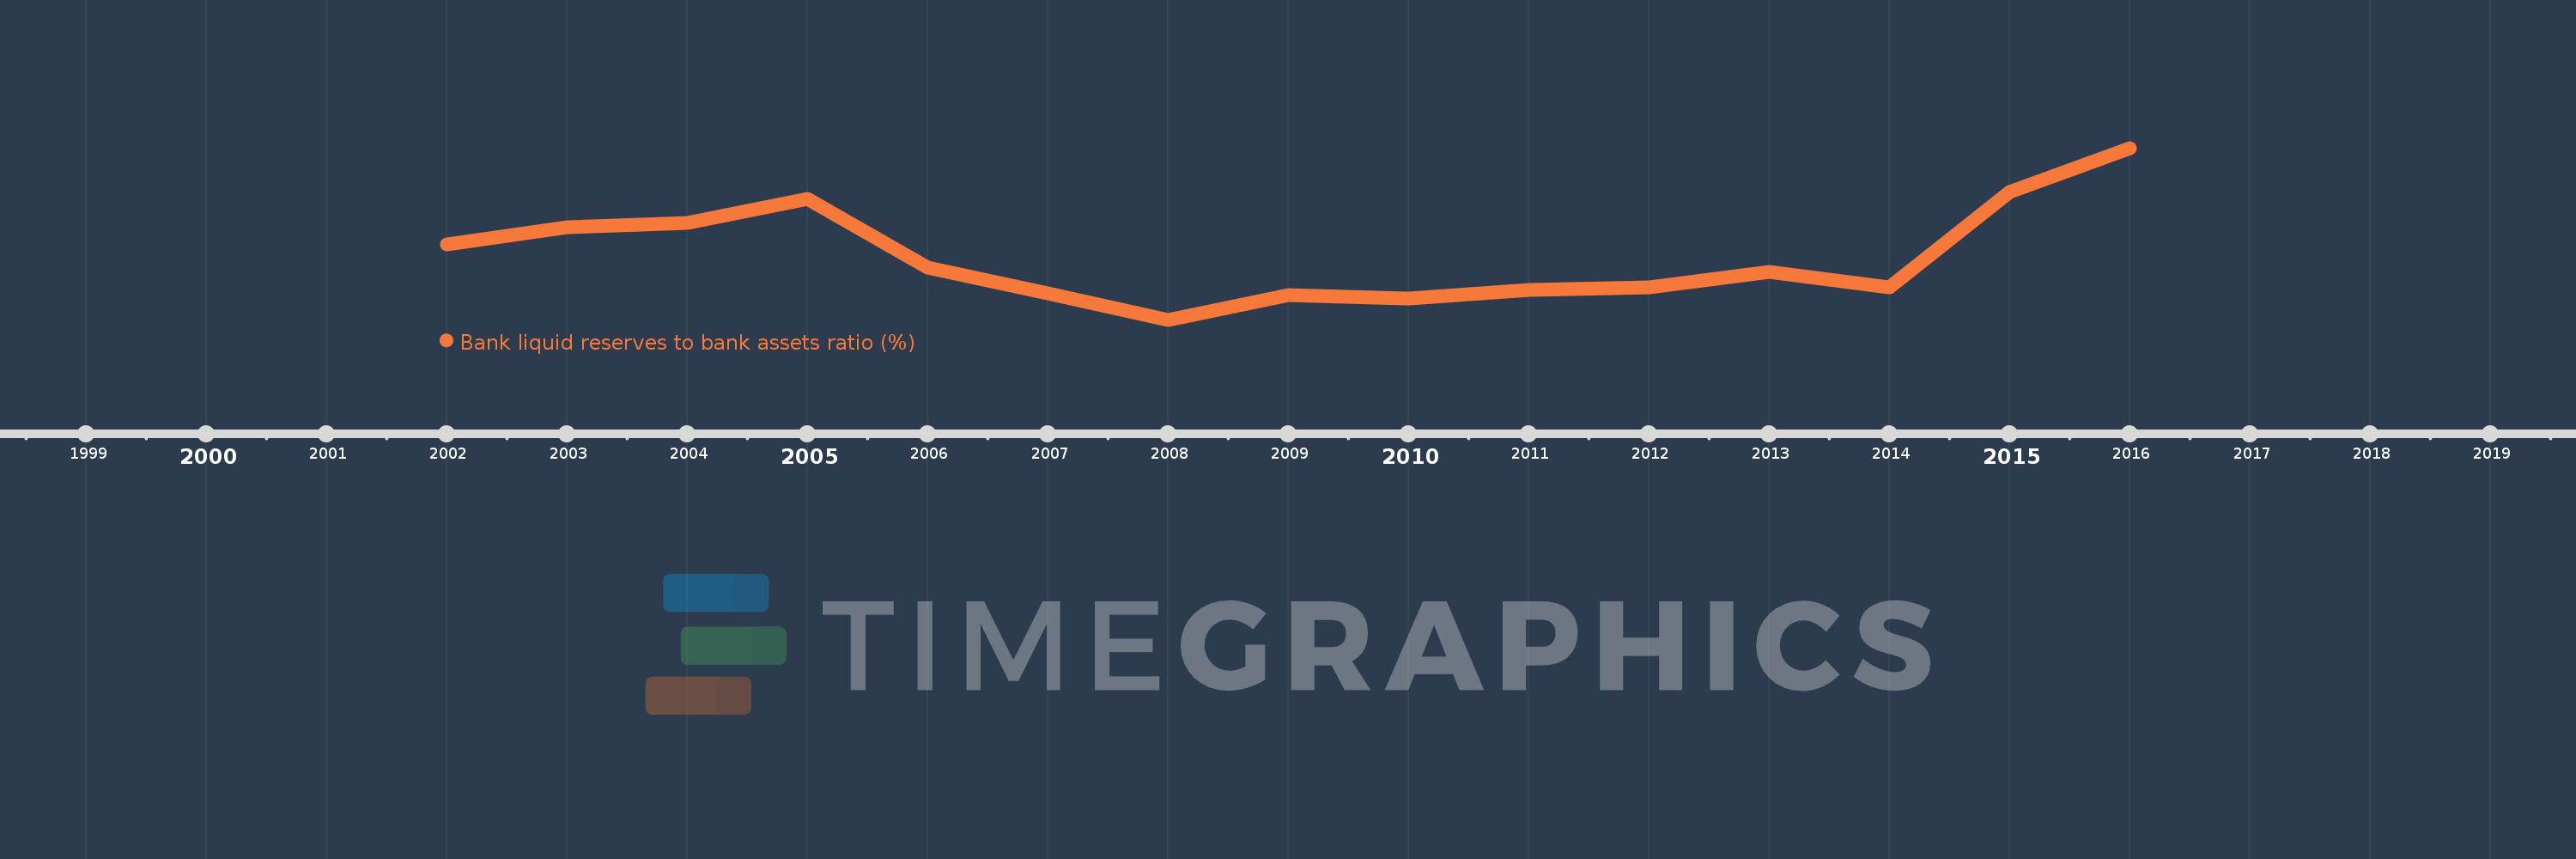
Bank liquid reserves to bank assets ratio (%)
2016,2015,2014,2013,2012,2011,2010,2009,2008,2007,2006,2005,2004,2003,2002
This statistics in other country:
Timeline:
This timeline shows a graph from 2002 to 2016 of St. Lucia. No data until 2001. Number of actual observations by date: 15.
Source name:
World Development Indicators
Source organization:
International Monetary Fund, International Financial Statistics and data files.
Categories, topics:
Financial Sector
Last updated:
apr 23, 2017
Indicators value changes by year
Maximum:
13.056
jan 1, 2016
At the date of observation
Value
Absolute change
Change from previous value
jan 1, 2002
8.425
+8.425
0.0%
jan 1, 2003
9.248
+0.823
9.77%
jan 1, 2004
9.442
+0.194
2.1%
jan 1, 2005
10.626
+1.184
12.54%
jan 1, 2006
7.331
-3.296
-31.01%
jan 1, 2007
6.091
-1.239
-16.91%
jan 1, 2008
4.808
-1.284
-21.07%
jan 1, 2009
5.983
+1.175
24.45%
jan 1, 2010
5.833
-0.15
-2.51%
jan 1, 2011
6.255
+0.422
7.24%
jan 1, 2012
6.348
+0.093
1.49%
jan 1, 2013
7.085
+0.737
11.61%
jan 1, 2014
6.377
-0.708
-10.0%
jan 1, 2015
10.953
+4.576
71.77%
jan 1, 2016
13.056
+2.103
19.2%
Ranking of countries by current statistics by years


Comments: