29
/
en
AIzaSyAYiBZKx7MnpbEhh9jyipgxe19OcubqV5w
April 1, 2024
46886
Lower middle income
LMC
false
2
1
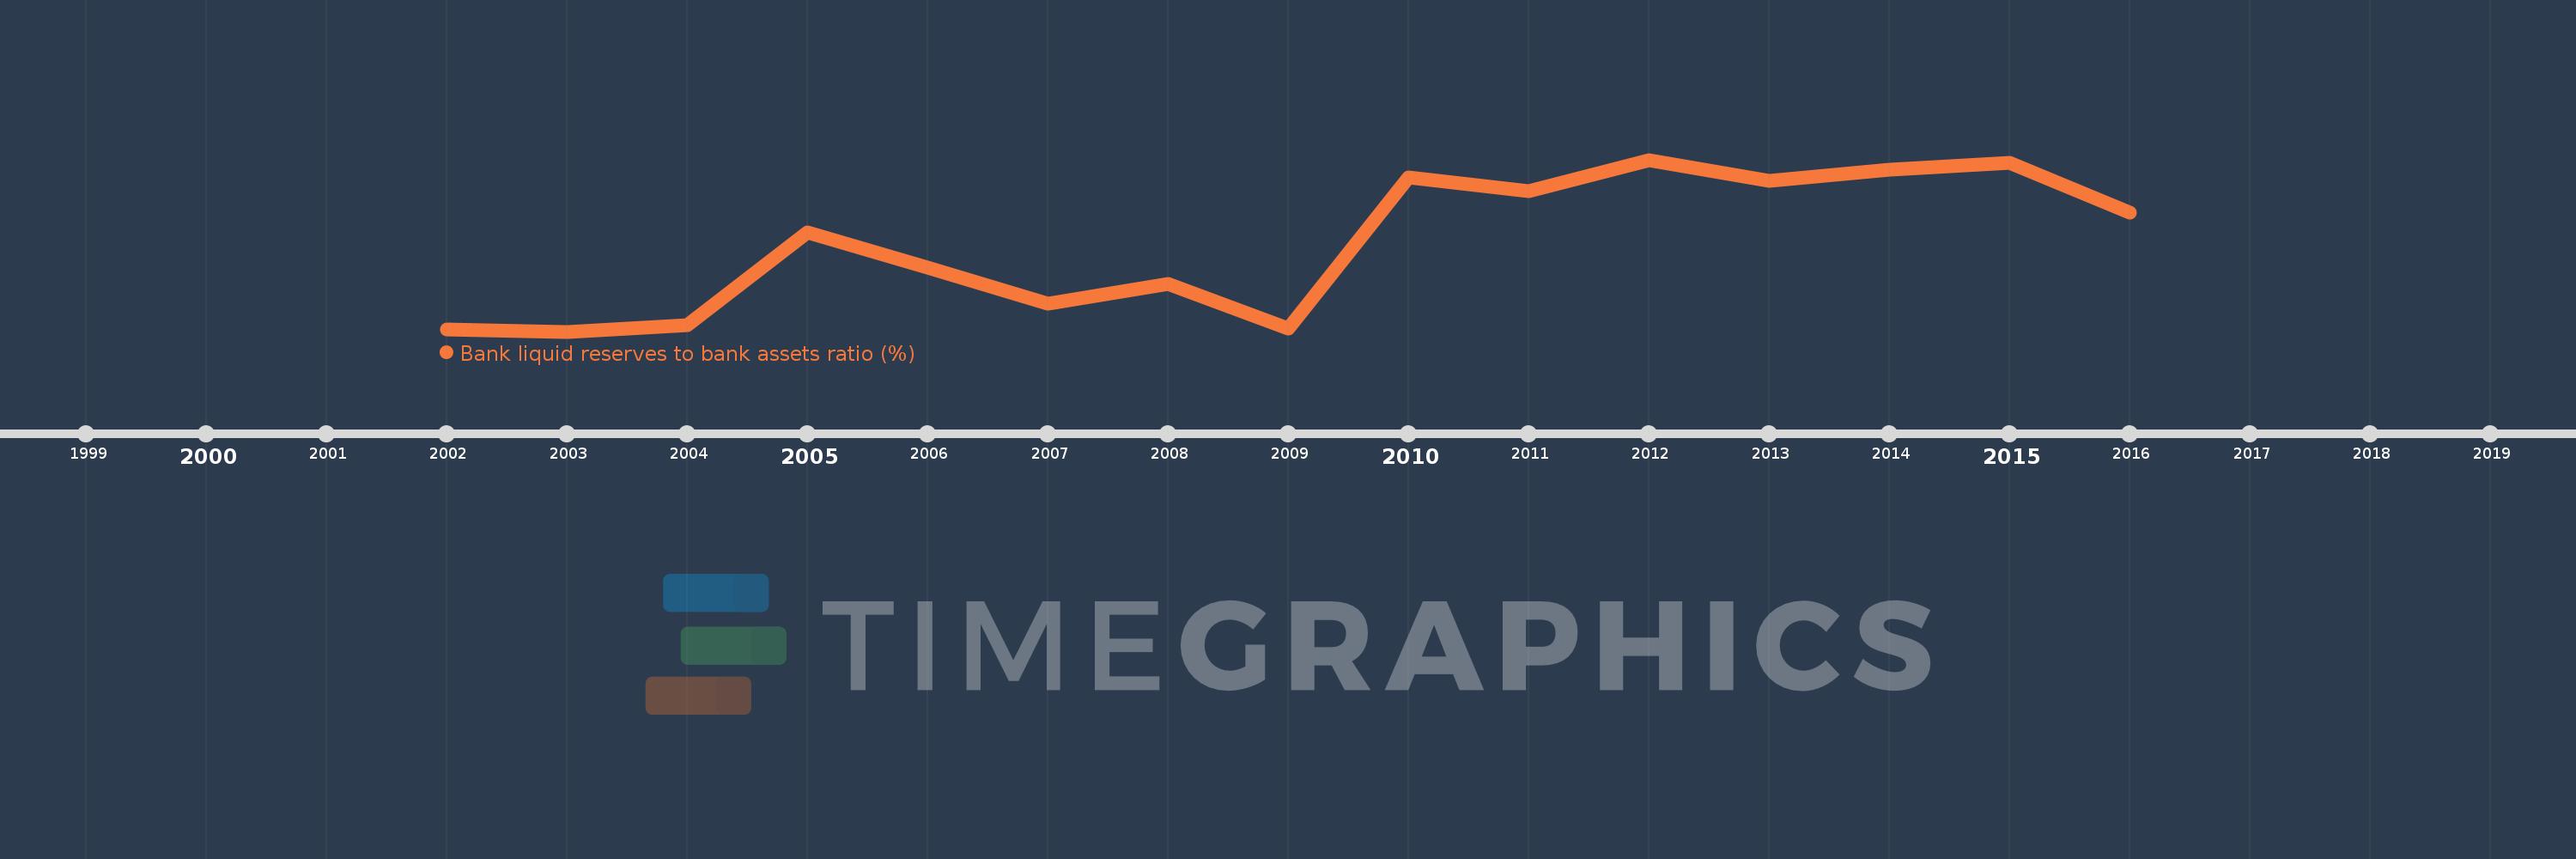
Bank liquid reserves to bank assets ratio (%)
2016,2015,2014,2013,2012,2011,2010,2009,2008,2007,2006,2005,2004,2003,2002
This statistics in other country:
Timeline:
This timeline shows a graph from 2002 to 2016 of Lower middle income. No data until 2001. Number of actual observations by date: 15.
Source name:
World Development Indicators
Source organization:
International Monetary Fund, International Financial Statistics and data files.
Categories, topics:
Financial Sector
Last updated:
apr 23, 2017
Indicators value changes by year
Minimum:
17.091
jan 1, 2003
Maximum:
25.459
jan 1, 2012
At the date of observation
Value
Absolute change
Change from previous value
jan 1, 2002
17.182
+17.182
0.0%
jan 1, 2003
17.091
-0.091
-0.53%
jan 1, 2004
17.387
+0.296
1.73%
jan 1, 2005
21.907
+4.521
26.0%
jan 1, 2006
20.19
-1.718
-7.84%
jan 1, 2007
18.461
-1.729
-8.56%
jan 1, 2008
19.404
+0.944
5.11%
jan 1, 2009
17.218
-2.186
-11.27%
jan 1, 2010
24.598
+7.379
42.86%
jan 1, 2011
23.933
-0.665
-2.7%
jan 1, 2012
25.459
+1.526
6.38%
jan 1, 2013
24.432
-1.027
-4.03%
jan 1, 2014
24.982
+0.55
2.25%
jan 1, 2015
25.322
+0.34
1.36%
jan 1, 2016
22.904
-2.419
-9.55%
Ranking of countries by current statistics by years


Comments: