29
/
en
AIzaSyAYiBZKx7MnpbEhh9jyipgxe19OcubqV5w
April 1, 2024
56536
Small states
SST
false
2
1
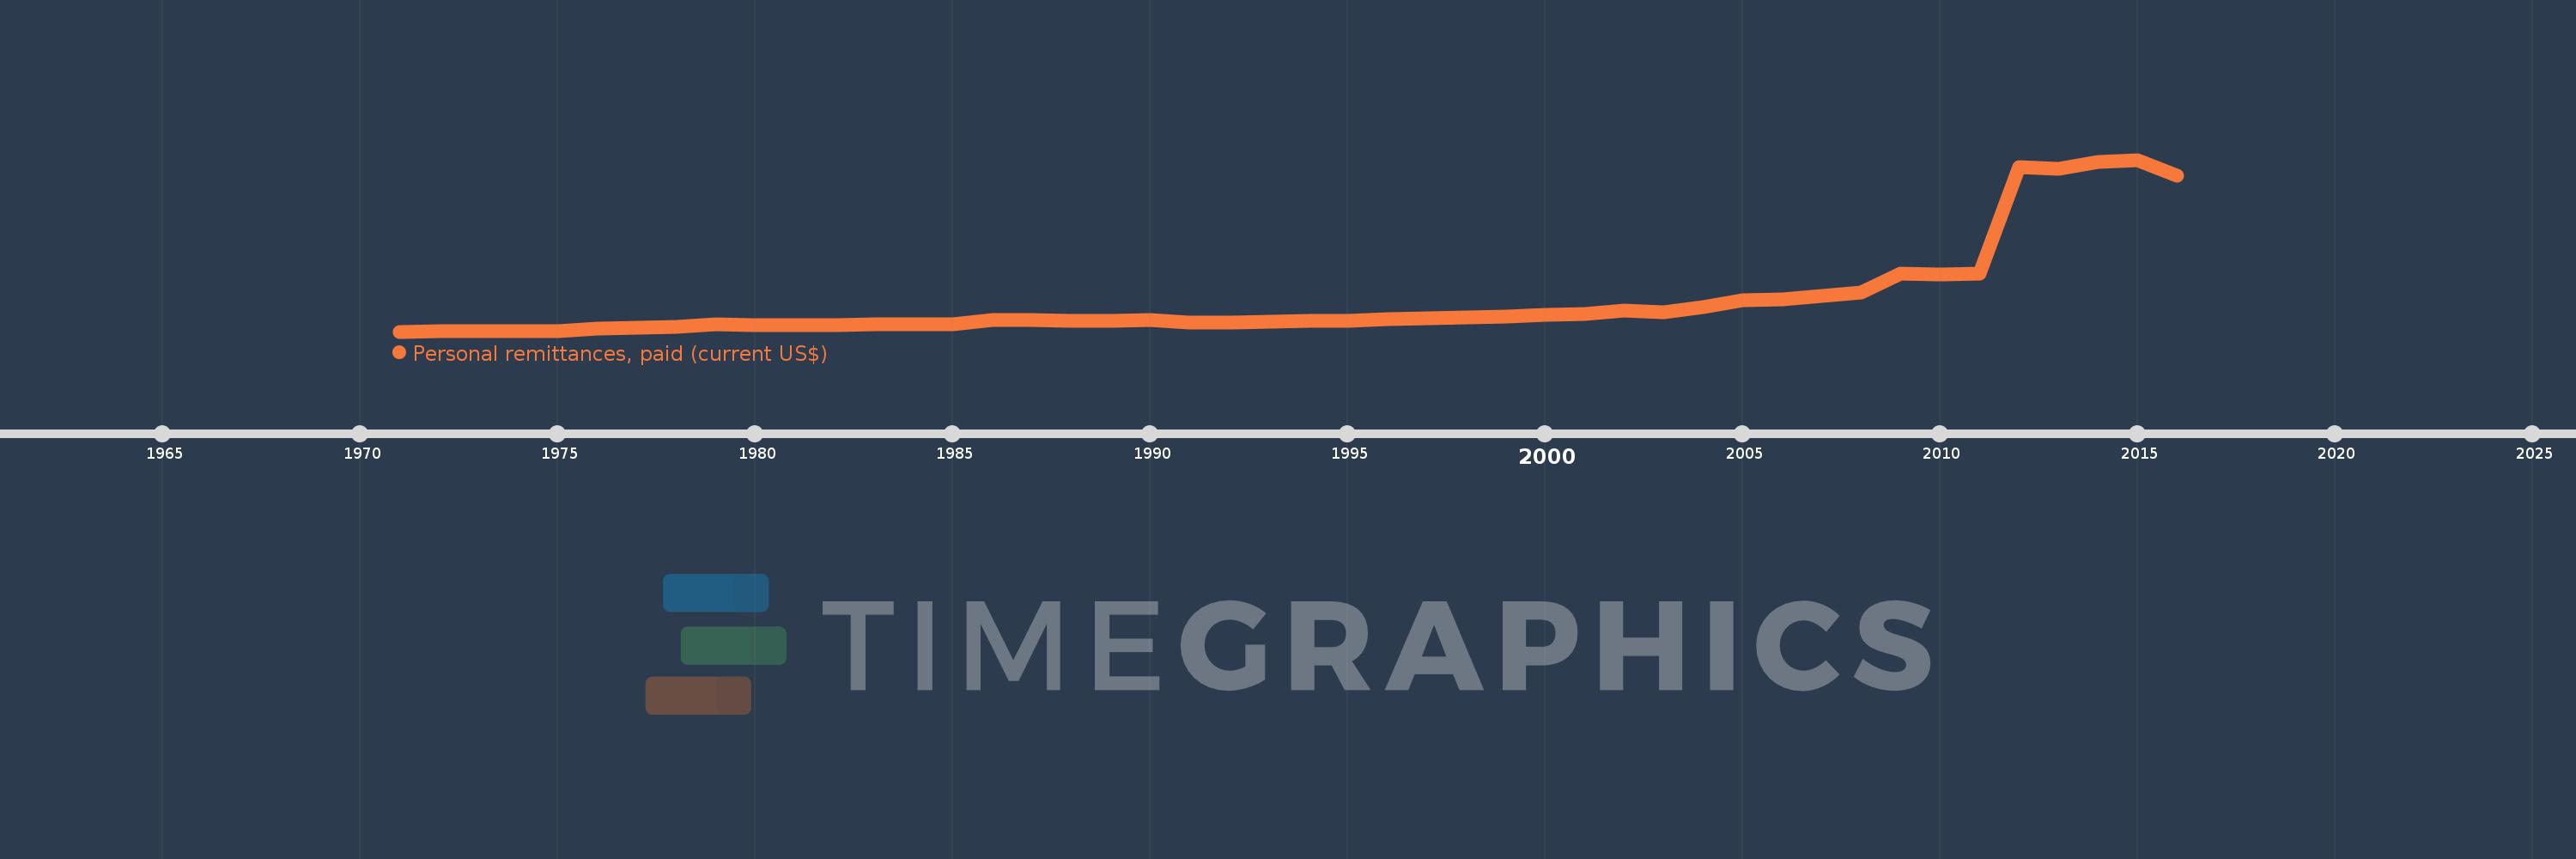
Personal remittances, paid (current US$)
2016,2015,2014,2013,2012,2011,2010,2009,2008,2007,2006,2005,2004,2003,2002,2001,2000,1999,1998,1997,1996,1995,1994,1993,1992,1991,1990,1989,1988,1987,1986,1985,1984,1983,1982,1981,1980,1979,1978,1977,1976,1975,1974,1973,1972,1971
This statistics in other country:
AfghanistanAlbaniaAlgeriaAngolaAntigua and BarbudaArab WorldArgentinaArmeniaArubaAustraliaAustriaAzerbaijanBahamas, TheBahrainBangladeshBarbadosBelarusBelgiumBelizeBeninBermudaBhutanBoliviaBosnia and HerzegovinaBotswanaBrazilBrunei DarussalamBulgariaBurkina FasoBurundiCabo VerdeCambodiaCameroonCanadaCaribbean small statesCentral African RepublicCentral Europe and the BalticsChadChileChinaColombiaComorosCongo, Dem. Rep.Congo, Rep.Costa RicaCote d'IvoireCroatiaCuracaoCyprusCzech RepublicDenmarkDjiboutiDominicaDominican RepublicEarly-demographic dividendEast Asia & PacificEast Asia & Pacific (excluding high income)East Asia & Pacific (IDA & IBRD countries)EcuadorEgypt, Arab Rep.El SalvadorEquatorial GuineaEritreaEstoniaEthiopiaEuro areaEurope & Central AsiaEurope & Central Asia (excluding high income)Europe & Central Asia (IDA & IBRD countries)European UnionFaroe IslandsFijiFinlandFragile and conflict affected situationsFranceFrench PolynesiaGabonGambia, TheGeorgiaGermanyGhanaGreeceGrenadaGuatemalaGuineaGuinea-BissauGuyanaHaitiHeavily indebted poor countries (HIPC)High incomeHondurasHong Kong SAR, ChinaHungaryIBRD onlyIcelandIDA & IBRD totalIDA blendIDA onlyIDA totalIndiaIndonesiaIraqIrelandIsraelItalyJamaicaJapanJordanKazakhstanKenyaKiribatiKorea, Rep.KosovoKuwaitKyrgyz RepublicLao PDRLate-demographic dividendLatin America & Caribbean Latin America & Caribbean (excluding high income)Latin America & the Caribbean (IDA & IBRD countries)LatviaLeast developed countries: UN classificationLebanonLesothoLiberiaLibyaLithuaniaLow & middle incomeLow incomeLower middle incomeLuxembourgMacao SAR, ChinaMacedonia, FYRMadagascarMalawiMalaysiaMaldivesMaliMaltaMarshall IslandsMauritaniaMauritiusMexicoMicronesia, Fed. Sts.Middle East & North AfricaMiddle East & North Africa (excluding high income)Middle East & North Africa (IDA & IBRD countries)Middle incomeMoldovaMongoliaMontenegroMoroccoMozambiqueMyanmarNamibiaNepalNetherlandsNew CaledoniaNew ZealandNicaraguaNigerNigeriaNorth AmericaNorwayOECD membersOmanOther small statesPacific island small statesPakistanPalauPanamaPapua New GuineaParaguayPeruPhilippinesPolandPortugalPost-demographic dividendPre-demographic dividendQatarRomaniaRussian FederationRwandaSamoaSao Tome and PrincipeSaudi ArabiaSenegalSerbiaSeychellesSierra LeoneSint Maarten (Dutch part)Slovak RepublicSloveniaSmall statesSolomon IslandsSomaliaSouth AfricaSouth AsiaSouth Asia (IDA & IBRD)South SudanSpainSri LankaSt. Kitts and NevisSt. LuciaSt. Vincent and the GrenadinesSub-Saharan Africa Sub-Saharan Africa (excluding high income)Sub-Saharan Africa (IDA & IBRD countries)SudanSurinameSwazilandSwedenSwitzerlandSyrian Arab RepublicTajikistanTanzaniaThailandTimor-LesteTogoTongaTrinidad and TobagoTunisiaTurkeyTurkmenistanTuvaluUgandaUkraineUnited KingdomUnited StatesUpper middle incomeUruguayVanuatuVenezuela, RBVietnamWest Bank and GazaWorldYemen, Rep.ZambiaZimbabwe Timeline:
This timeline shows a graph from 1971 to 2016 of Small states. No data until 1970. Number of actual observations by date: 46.
Source name:
World Development Indicators
Source organization:
World Bank staff estimates based on IMF balance of payments data.
Categories, topics:
Economy & Growth, Financial Sector
Last updated:
apr 23, 2017
Indicators value changes by year
Minimum:
550.0K
jan 1, 1971
Maximum:
17.05 bln
jan 1, 2015
At the date of observation
Value
Absolute change
Change from previous value
jan 1, 1971
550.0K
+550.0K
0.0%
jan 1, 1972
3.59 mln
+3.04 mln
552.68%
jan 1, 1973
4.658 mln
+1.069 mln
29.77%
jan 1, 1974
5.641 mln
+982.346K
21.09%
jan 1, 1975
3.953 mln
-1.688 mln
-29.92%
jan 1, 1976
283.536 mln
+279.583 mln
7.07K%
jan 1, 1977
416.483 mln
+132.947 mln
46.89%
jan 1, 1978
489.55 mln
+73.067 mln
17.54%
jan 1, 1979
683.935 mln
+194.385 mln
39.71%
jan 1, 1980
626.241 mln
-57.694 mln
-8.44%
jan 1, 1981
680.578 mln
+54.337 mln
8.68%
jan 1, 1982
668.589 mln
-11.989 mln
-1.76%
jan 1, 1983
716.696 mln
+48.107 mln
7.2%
jan 1, 1984
695.619 mln
-21.077 mln
-2.94%
jan 1, 1985
751.662 mln
+56.043 mln
8.06%
jan 1, 1986
1.138 bln
+386.784 mln
51.46%
jan 1, 1987
1.143 bln
+5.01 mln
0.44%
jan 1, 1988
1.071 bln
-72.225 mln
-6.32%
jan 1, 1989
1.083 bln
+11.314 mln
1.06%
jan 1, 1990
1.129 bln
+46.396 mln
4.29%
jan 1, 1991
916.065 mln
-212.875 mln
-18.86%
jan 1, 1992
937.239 mln
+21.174 mln
2.31%
jan 1, 1993
958.794 mln
+21.555 mln
2.3%
jan 1, 1994
1.026 bln
+67.577 mln
7.05%
jan 1, 1995
1.06 bln
+33.464 mln
3.26%
jan 1, 1996
1.259 bln
+198.886 mln
18.77%
jan 1, 1997
1.321 bln
+62.403 mln
4.96%
jan 1, 1998
1.401 bln
+79.948 mln
6.05%
jan 1, 1999
1.49 bln
+88.7 mln
6.33%
jan 1, 2000
1.689 bln
+198.968 mln
13.36%
jan 1, 2001
1.722 bln
+33.028 mln
1.96%
jan 1, 2002
2.083 bln
+361.077 mln
20.97%
jan 1, 2003
1.899 bln
-183.982 mln
-8.83%
jan 1, 2004
2.417 bln
+518.021 mln
27.28%
jan 1, 2005
3.114 bln
+697.567 mln
28.86%
jan 1, 2006
3.22 bln
+105.275 mln
3.38%
jan 1, 2007
3.554 bln
+334.038 mln
10.37%
jan 1, 2008
3.902 bln
+348.267 mln
9.8%
jan 1, 2009
5.727 bln
+1.825 bln
46.76%
jan 1, 2010
5.709 bln
-17.759 mln
-0.31%
jan 1, 2011
5.778 bln
+68.877 mln
1.21%
jan 1, 2012
16.303 bln
+10.526 bln
182.18%
jan 1, 2013
16.188 bln
-115.6 mln
-0.71%
jan 1, 2014
16.851 bln
+663.068 mln
4.1%
jan 1, 2015
17.05 bln
+199.735 mln
1.19%
jan 1, 2016
15.499 bln
-1.551 bln
-9.1%
Ranking of countries by current statistics by years


Comments: