29
/
en
AIzaSyAYiBZKx7MnpbEhh9jyipgxe19OcubqV5w
April 1, 2024
209666
New Zealand
NZL
true
2
1
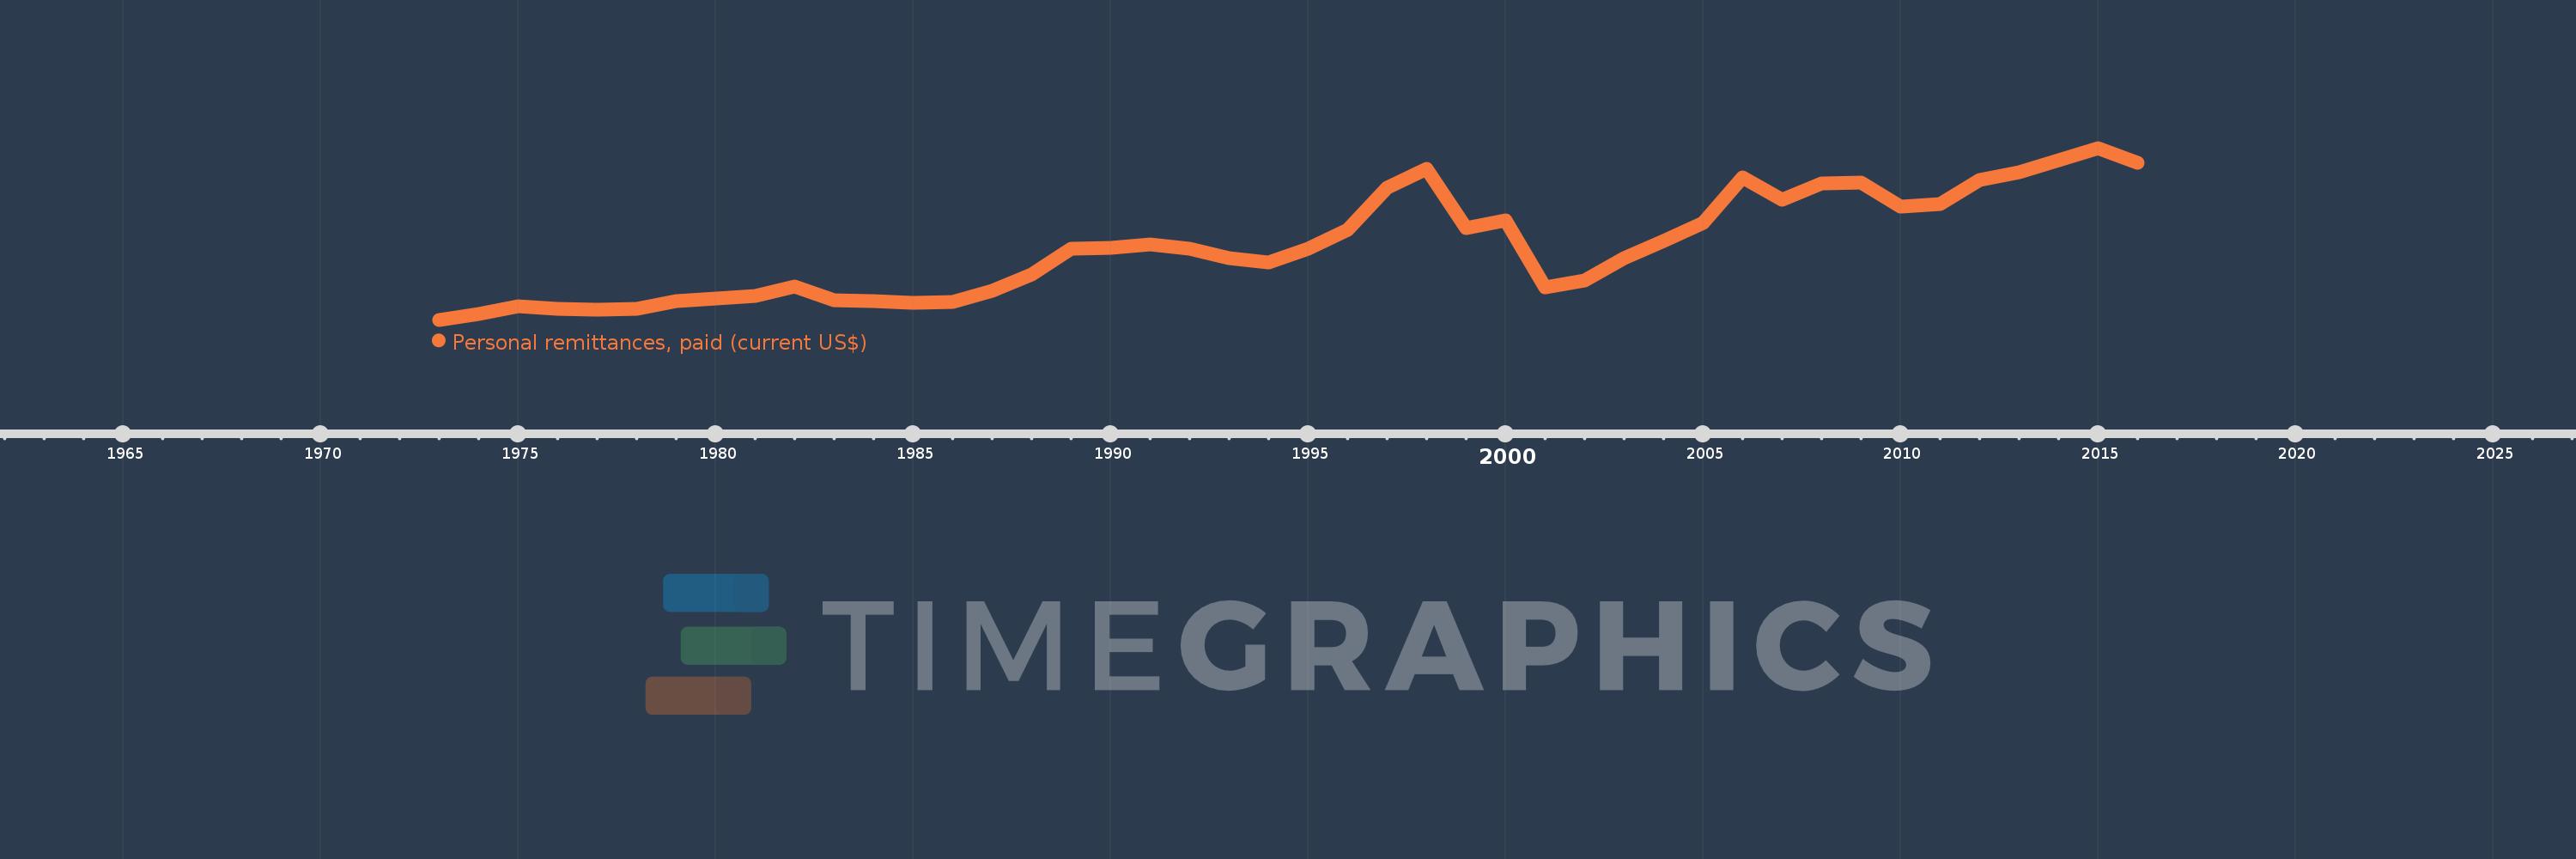
Personal remittances, paid (current US$)
2016,2015,2014,2013,2012,2011,2010,2009,2008,2007,2006,2005,2004,2003,2002,2001,2000,1999,1998,1997,1996,1995,1994,1993,1992,1991,1990,1989,1988,1987,1986,1985,1984,1983,1982,1981,1980,1979,1978,1977,1976,1975,1974,1973
This statistics in other country:
AfghanistanAlbaniaAlgeriaAngolaAntigua and BarbudaArab WorldArgentinaArmeniaArubaAustraliaAustriaAzerbaijanBahamas, TheBahrainBangladeshBarbadosBelarusBelgiumBelizeBeninBermudaBhutanBoliviaBosnia and HerzegovinaBotswanaBrazilBrunei DarussalamBulgariaBurkina FasoBurundiCabo VerdeCambodiaCameroonCanadaCaribbean small statesCentral African RepublicCentral Europe and the BalticsChadChileChinaColombiaComorosCongo, Dem. Rep.Congo, Rep.Costa RicaCote d'IvoireCroatiaCuracaoCyprusCzech RepublicDenmarkDjiboutiDominicaDominican RepublicEarly-demographic dividendEast Asia & PacificEast Asia & Pacific (excluding high income)East Asia & Pacific (IDA & IBRD countries)EcuadorEgypt, Arab Rep.El SalvadorEquatorial GuineaEritreaEstoniaEthiopiaEuro areaEurope & Central AsiaEurope & Central Asia (excluding high income)Europe & Central Asia (IDA & IBRD countries)European UnionFaroe IslandsFijiFinlandFragile and conflict affected situationsFranceFrench PolynesiaGabonGambia, TheGeorgiaGermanyGhanaGreeceGrenadaGuatemalaGuineaGuinea-BissauGuyanaHaitiHeavily indebted poor countries (HIPC)High incomeHondurasHong Kong SAR, ChinaHungaryIBRD onlyIcelandIDA & IBRD totalIDA blendIDA onlyIDA totalIndiaIndonesiaIraqIrelandIsraelItalyJamaicaJapanJordanKazakhstanKenyaKiribatiKorea, Rep.KosovoKuwaitKyrgyz RepublicLao PDRLate-demographic dividendLatin America & Caribbean Latin America & Caribbean (excluding high income)Latin America & the Caribbean (IDA & IBRD countries)LatviaLeast developed countries: UN classificationLebanonLesothoLiberiaLibyaLithuaniaLow & middle incomeLow incomeLower middle incomeLuxembourgMacao SAR, ChinaMacedonia, FYRMadagascarMalawiMalaysiaMaldivesMaliMaltaMarshall IslandsMauritaniaMauritiusMexicoMicronesia, Fed. Sts.Middle East & North AfricaMiddle East & North Africa (excluding high income)Middle East & North Africa (IDA & IBRD countries)Middle incomeMoldovaMongoliaMontenegroMoroccoMozambiqueMyanmarNamibiaNepalNetherlandsNew CaledoniaNew ZealandNicaraguaNigerNigeriaNorth AmericaNorwayOECD membersOmanOther small statesPacific island small statesPakistanPalauPanamaPapua New GuineaParaguayPeruPhilippinesPolandPortugalPost-demographic dividendPre-demographic dividendQatarRomaniaRussian FederationRwandaSamoaSao Tome and PrincipeSaudi ArabiaSenegalSerbiaSeychellesSierra LeoneSint Maarten (Dutch part)Slovak RepublicSloveniaSmall statesSolomon IslandsSomaliaSouth AfricaSouth AsiaSouth Asia (IDA & IBRD)South SudanSpainSri LankaSt. Kitts and NevisSt. LuciaSt. Vincent and the GrenadinesSub-Saharan Africa Sub-Saharan Africa (excluding high income)Sub-Saharan Africa (IDA & IBRD countries)SudanSurinameSwazilandSwedenSwitzerlandSyrian Arab RepublicTajikistanTanzaniaThailandTimor-LesteTogoTongaTrinidad and TobagoTunisiaTurkeyTurkmenistanTuvaluUgandaUkraineUnited KingdomUnited StatesUpper middle incomeUruguayVanuatuVenezuela, RBVietnamWest Bank and GazaWorldYemen, Rep.ZambiaZimbabwe Timeline:
This timeline shows a graph from 1973 to 2016 of New Zealand. No data until 1972. Number of actual observations by date: 44.
Source name:
World Development Indicators
Source organization:
World Bank staff estimates based on IMF balance of payments data.
Categories, topics:
Economy & Growth, Financial Sector
Last updated:
apr 23, 2017
Indicators value changes by year
Minimum:
52.589 mln
jan 1, 1973
Maximum:
769.854 mln
jan 1, 2015
At the date of observation
Value
Absolute change
Change from previous value
jan 1, 1973
52.589 mln
+52.589 mln
0.0%
jan 1, 1974
77.36 mln
+24.771 mln
47.1%
jan 1, 1975
109.03 mln
+31.669 mln
40.94%
jan 1, 1976
99.723 mln
-9.307 mln
-8.54%
jan 1, 1977
95.533 mln
-4.19 mln
-4.2%
jan 1, 1978
98.999 mln
+3.466 mln
3.63%
jan 1, 1979
129.611 mln
+30.612 mln
30.92%
jan 1, 1980
140.01 mln
+10.399 mln
8.02%
jan 1, 1981
150.952 mln
+10.942 mln
7.82%
jan 1, 1982
192.109 mln
+41.158 mln
27.27%
jan 1, 1983
134.222 mln
-57.888 mln
-30.13%
jan 1, 1984
131.855 mln
-2.367 mln
-1.76%
jan 1, 1985
121.54 mln
-10.316 mln
-7.82%
jan 1, 1986
126.944 mln
+5.405 mln
4.45%
jan 1, 1987
171.737 mln
+44.793 mln
35.29%
jan 1, 1988
241.906 mln
+70.168 mln
40.86%
jan 1, 1989
347.439 mln
+105.533 mln
43.63%
jan 1, 1990
352.946 mln
+5.507 mln
1.59%
jan 1, 1991
366.592 mln
+13.646 mln
3.87%
jan 1, 1992
349.928 mln
-16.664 mln
-4.55%
jan 1, 1993
310.627 mln
-39.301 mln
-11.23%
jan 1, 1994
290.843 mln
-19.784 mln
-6.37%
jan 1, 1995
349.058 mln
+58.214 mln
20.02%
jan 1, 1996
427.224 mln
+78.167 mln
22.39%
jan 1, 1997
604.967 mln
+177.743 mln
41.6%
jan 1, 1998
683.439 mln
+78.471 mln
12.97%
jan 1, 1999
436.495 mln
-246.944 mln
-36.13%
jan 1, 2000
469.204 mln
+32.709 mln
7.49%
jan 1, 2001
187.155 mln
-282.049 mln
-60.11%
jan 1, 2002
215.634 mln
+28.479 mln
15.22%
jan 1, 2003
310.922 mln
+95.287 mln
44.19%
jan 1, 2004
381.77 mln
+70.848 mln
22.79%
jan 1, 2005
457.332 mln
+75.562 mln
19.79%
jan 1, 2006
647.308 mln
+189.976 mln
41.54%
jan 1, 2007
552.022 mln
-95.286 mln
-14.72%
jan 1, 2008
622.56 mln
+70.538 mln
12.78%
jan 1, 2009
624.258 mln
+1.699 mln
0.27%
jan 1, 2010
524.454 mln
-99.804 mln
-15.99%
jan 1, 2011
533.918 mln
+9.464 mln
1.8%
jan 1, 2012
636.205 mln
+102.287 mln
19.16%
jan 1, 2013
668.885 mln
+32.68 mln
5.14%
jan 1, 2014
716.983 mln
+48.098 mln
7.19%
jan 1, 2015
769.854 mln
+52.871 mln
7.37%
jan 1, 2016
706.39 mln
-63.465 mln
-8.24%
Ranking of countries by current statistics by years


Comments: