29
/
en
AIzaSyAYiBZKx7MnpbEhh9jyipgxe19OcubqV5w
April 1, 2024
134481
France
FRA
true
2
1
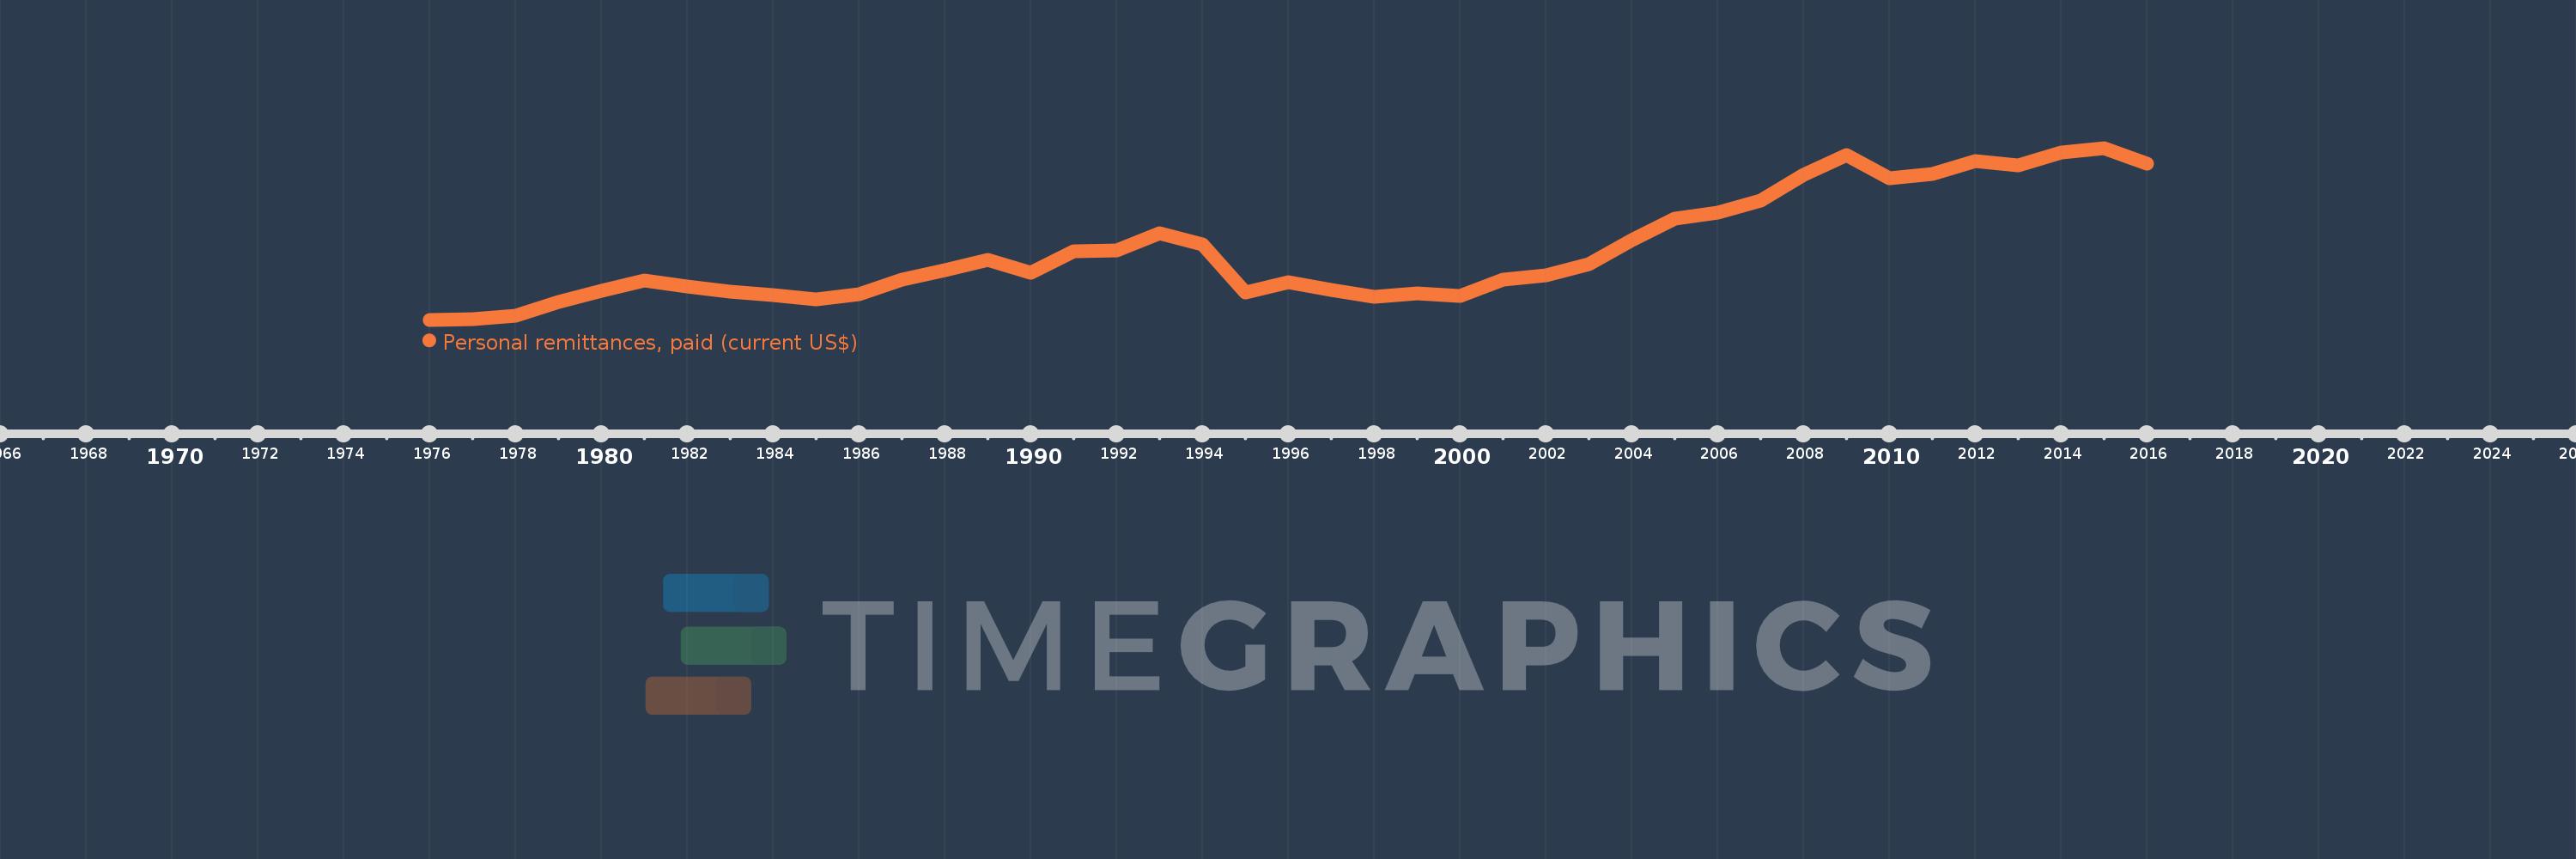
Personal remittances, paid (current US$)
2016,2015,2014,2013,2012,2011,2010,2009,2008,2007,2006,2005,2004,2003,2002,2001,2000,1999,1998,1997,1996,1995,1994,1993,1992,1991,1990,1989,1988,1987,1986,1985,1984,1983,1982,1981,1980,1979,1978,1977,1976
This statistics in other country:
AfghanistanAlbaniaAlgeriaAngolaAntigua and BarbudaArab WorldArgentinaArmeniaArubaAustraliaAustriaAzerbaijanBahamas, TheBahrainBangladeshBarbadosBelarusBelgiumBelizeBeninBermudaBhutanBoliviaBosnia and HerzegovinaBotswanaBrazilBrunei DarussalamBulgariaBurkina FasoBurundiCabo VerdeCambodiaCameroonCanadaCaribbean small statesCentral African RepublicCentral Europe and the BalticsChadChileChinaColombiaComorosCongo, Dem. Rep.Congo, Rep.Costa RicaCote d'IvoireCroatiaCuracaoCyprusCzech RepublicDenmarkDjiboutiDominicaDominican RepublicEarly-demographic dividendEast Asia & PacificEast Asia & Pacific (excluding high income)East Asia & Pacific (IDA & IBRD countries)EcuadorEgypt, Arab Rep.El SalvadorEquatorial GuineaEritreaEstoniaEthiopiaEuro areaEurope & Central AsiaEurope & Central Asia (excluding high income)Europe & Central Asia (IDA & IBRD countries)European UnionFaroe IslandsFijiFinlandFragile and conflict affected situationsFranceFrench PolynesiaGabonGambia, TheGeorgiaGermanyGhanaGreeceGrenadaGuatemalaGuineaGuinea-BissauGuyanaHaitiHeavily indebted poor countries (HIPC)High incomeHondurasHong Kong SAR, ChinaHungaryIBRD onlyIcelandIDA & IBRD totalIDA blendIDA onlyIDA totalIndiaIndonesiaIraqIrelandIsraelItalyJamaicaJapanJordanKazakhstanKenyaKiribatiKorea, Rep.KosovoKuwaitKyrgyz RepublicLao PDRLate-demographic dividendLatin America & Caribbean Latin America & Caribbean (excluding high income)Latin America & the Caribbean (IDA & IBRD countries)LatviaLeast developed countries: UN classificationLebanonLesothoLiberiaLibyaLithuaniaLow & middle incomeLow incomeLower middle incomeLuxembourgMacao SAR, ChinaMacedonia, FYRMadagascarMalawiMalaysiaMaldivesMaliMaltaMarshall IslandsMauritaniaMauritiusMexicoMicronesia, Fed. Sts.Middle East & North AfricaMiddle East & North Africa (excluding high income)Middle East & North Africa (IDA & IBRD countries)Middle incomeMoldovaMongoliaMontenegroMoroccoMozambiqueMyanmarNamibiaNepalNetherlandsNew CaledoniaNew ZealandNicaraguaNigerNigeriaNorth AmericaNorwayOECD membersOmanOther small statesPacific island small statesPakistanPalauPanamaPapua New GuineaParaguayPeruPhilippinesPolandPortugalPost-demographic dividendPre-demographic dividendQatarRomaniaRussian FederationRwandaSamoaSao Tome and PrincipeSaudi ArabiaSenegalSerbiaSeychellesSierra LeoneSint Maarten (Dutch part)Slovak RepublicSloveniaSmall statesSolomon IslandsSomaliaSouth AfricaSouth AsiaSouth Asia (IDA & IBRD)South SudanSpainSri LankaSt. Kitts and NevisSt. LuciaSt. Vincent and the GrenadinesSub-Saharan Africa Sub-Saharan Africa (excluding high income)Sub-Saharan Africa (IDA & IBRD countries)SudanSurinameSwazilandSwedenSwitzerlandSyrian Arab RepublicTajikistanTanzaniaThailandTimor-LesteTogoTongaTrinidad and TobagoTunisiaTurkeyTurkmenistanTuvaluUgandaUkraineUnited KingdomUnited StatesUpper middle incomeUruguayVanuatuVenezuela, RBVietnamWest Bank and GazaWorldYemen, Rep.ZambiaZimbabwe Timeline:
This timeline shows a graph from 1976 to 2016 of France. No data until 1975. Number of actual observations by date: 41.
Source name:
World Development Indicators
Source organization:
World Bank staff estimates based on IMF balance of payments data.
Categories, topics:
Economy & Growth, Financial Sector
Last updated:
apr 23, 2017
Indicators value changes by year
Minimum:
2.506 bln
jan 1, 1976
Maximum:
13.717 bln
jan 1, 2015
At the date of observation
Value
Absolute change
Change from previous value
jan 1, 1976
2.506 bln
+2.506 bln
0.0%
jan 1, 1977
2.526 bln
+19.89 mln
0.79%
jan 1, 1978
2.768 bln
+241.976 mln
9.58%
jan 1, 1979
3.671 bln
+903.093 mln
32.62%
jan 1, 1980
4.372 bln
+701.23 mln
19.1%
jan 1, 1981
5.07 bln
+697.617 mln
15.95%
jan 1, 1982
4.669 bln
-401.199 mln
-7.91%
jan 1, 1983
4.341 bln
-327.853 mln
-7.02%
jan 1, 1984
4.114 bln
-226.909 mln
-5.23%
jan 1, 1985
3.839 bln
-275.123 mln
-6.69%
jan 1, 1986
4.173 bln
+333.737 mln
8.69%
jan 1, 1987
5.141 bln
+968.597 mln
23.21%
jan 1, 1988
5.76 bln
+618.443 mln
12.03%
jan 1, 1989
6.388 bln
+627.835 mln
10.9%
jan 1, 1990
5.569 bln
-818.917 mln
-12.82%
jan 1, 1991
6.949 bln
+1.381 bln
24.79%
jan 1, 1992
7.022 bln
+72.206 mln
1.04%
jan 1, 1993
8.152 bln
+1.131 bln
16.11%
jan 1, 1994
7.434 bln
-718.562 mln
-8.81%
jan 1, 1995
4.28 bln
-3.154 bln
-42.42%
jan 1, 1996
4.935 bln
+654.776 mln
15.3%
jan 1, 1997
4.463 bln
-472.131 mln
-9.57%
jan 1, 1998
3.991 bln
-471.962 mln
-10.58%
jan 1, 1999
4.237 bln
+245.734 mln
6.16%
jan 1, 2000
4.086 bln
-150.329 mln
-3.55%
jan 1, 2001
5.121 bln
+1.034 bln
25.31%
jan 1, 2002
5.383 bln
+262.306 mln
5.12%
jan 1, 2003
6.128 bln
+745.076 mln
13.84%
jan 1, 2004
7.715 bln
+1.587 bln
25.9%
jan 1, 2005
9.088 bln
+1.373 bln
17.79%
jan 1, 2006
9.475 bln
+386.766 mln
4.26%
jan 1, 2007
10.281 bln
+806.409 mln
8.51%
jan 1, 2008
11.947 bln
+1.666 bln
16.2%
jan 1, 2009
13.269 bln
+1.322 bln
11.06%
jan 1, 2010
11.757 bln
-1.512 bln
-11.39%
jan 1, 2011
12.029 bln
+271.948 mln
2.31%
jan 1, 2012
12.849 bln
+820.065 mln
6.82%
jan 1, 2013
12.566 bln
-283.488 mln
-2.21%
jan 1, 2014
13.425 bln
+859.539 mln
6.84%
jan 1, 2015
13.717 bln
+291.505 mln
2.17%
jan 1, 2016
12.675 bln
-1.042 bln
-7.59%
Ranking of countries by current statistics by years


Comments: