29
/
en
AIzaSyAYiBZKx7MnpbEhh9jyipgxe19OcubqV5w
April 1, 2024
40237
IDA total
IDA
false
2
1
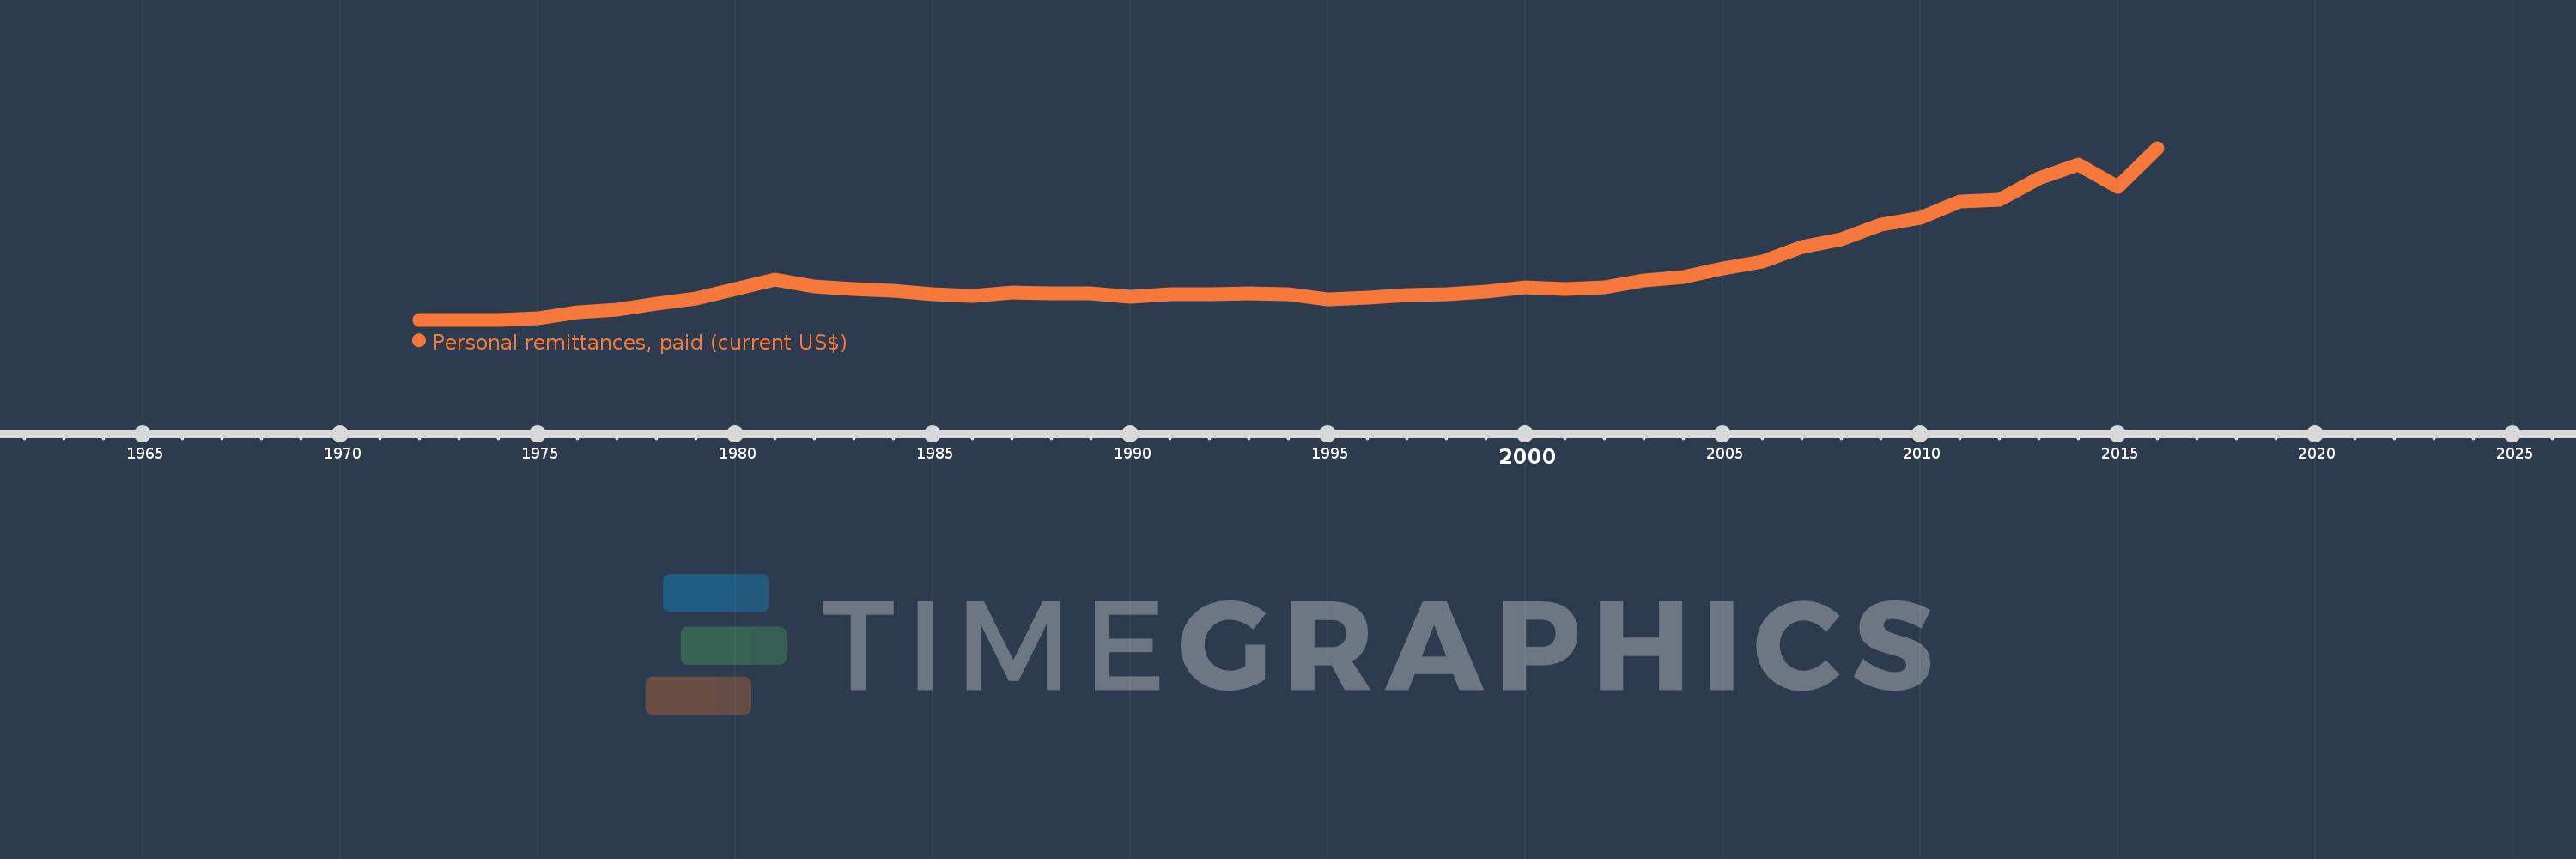
Personal remittances, paid (current US$)
2016,2015,2014,2013,2012,2011,2010,2009,2008,2007,2006,2005,2004,2003,2002,2001,2000,1999,1998,1997,1996,1995,1994,1993,1992,1991,1990,1989,1988,1987,1986,1985,1984,1983,1982,1981,1980,1979,1978,1977,1976,1975,1974,1973,1972
This statistics in other country:
AfghanistanAlbaniaAlgeriaAngolaAntigua and BarbudaArab WorldArgentinaArmeniaArubaAustraliaAustriaAzerbaijanBahamas, TheBahrainBangladeshBarbadosBelarusBelgiumBelizeBeninBermudaBhutanBoliviaBosnia and HerzegovinaBotswanaBrazilBrunei DarussalamBulgariaBurkina FasoBurundiCabo VerdeCambodiaCameroonCanadaCaribbean small statesCentral African RepublicCentral Europe and the BalticsChadChileChinaColombiaComorosCongo, Dem. Rep.Congo, Rep.Costa RicaCote d'IvoireCroatiaCuracaoCyprusCzech RepublicDenmarkDjiboutiDominicaDominican RepublicEarly-demographic dividendEast Asia & PacificEast Asia & Pacific (excluding high income)East Asia & Pacific (IDA & IBRD countries)EcuadorEgypt, Arab Rep.El SalvadorEquatorial GuineaEritreaEstoniaEthiopiaEuro areaEurope & Central AsiaEurope & Central Asia (excluding high income)Europe & Central Asia (IDA & IBRD countries)European UnionFaroe IslandsFijiFinlandFragile and conflict affected situationsFranceFrench PolynesiaGabonGambia, TheGeorgiaGermanyGhanaGreeceGrenadaGuatemalaGuineaGuinea-BissauGuyanaHaitiHeavily indebted poor countries (HIPC)High incomeHondurasHong Kong SAR, ChinaHungaryIBRD onlyIcelandIDA & IBRD totalIDA blendIDA onlyIDA totalIndiaIndonesiaIraqIrelandIsraelItalyJamaicaJapanJordanKazakhstanKenyaKiribatiKorea, Rep.KosovoKuwaitKyrgyz RepublicLao PDRLate-demographic dividendLatin America & Caribbean Latin America & Caribbean (excluding high income)Latin America & the Caribbean (IDA & IBRD countries)LatviaLeast developed countries: UN classificationLebanonLesothoLiberiaLibyaLithuaniaLow & middle incomeLow incomeLower middle incomeLuxembourgMacao SAR, ChinaMacedonia, FYRMadagascarMalawiMalaysiaMaldivesMaliMaltaMarshall IslandsMauritaniaMauritiusMexicoMicronesia, Fed. Sts.Middle East & North AfricaMiddle East & North Africa (excluding high income)Middle East & North Africa (IDA & IBRD countries)Middle incomeMoldovaMongoliaMontenegroMoroccoMozambiqueMyanmarNamibiaNepalNetherlandsNew CaledoniaNew ZealandNicaraguaNigerNigeriaNorth AmericaNorwayOECD membersOmanOther small statesPacific island small statesPakistanPalauPanamaPapua New GuineaParaguayPeruPhilippinesPolandPortugalPost-demographic dividendPre-demographic dividendQatarRomaniaRussian FederationRwandaSamoaSao Tome and PrincipeSaudi ArabiaSenegalSerbiaSeychellesSierra LeoneSint Maarten (Dutch part)Slovak RepublicSloveniaSmall statesSolomon IslandsSomaliaSouth AfricaSouth AsiaSouth Asia (IDA & IBRD)South SudanSpainSri LankaSt. Kitts and NevisSt. LuciaSt. Vincent and the GrenadinesSub-Saharan Africa Sub-Saharan Africa (excluding high income)Sub-Saharan Africa (IDA & IBRD countries)SudanSurinameSwazilandSwedenSwitzerlandSyrian Arab RepublicTajikistanTanzaniaThailandTimor-LesteTogoTongaTrinidad and TobagoTunisiaTurkeyTurkmenistanTuvaluUgandaUkraineUnited KingdomUnited StatesUpper middle incomeUruguayVanuatuVenezuela, RBVietnamWest Bank and GazaWorldYemen, Rep.ZambiaZimbabwe Timeline:
This timeline shows a graph from 1972 to 2016 of IDA total. No data until 1971. Number of actual observations by date: 45.
Source name:
World Development Indicators
Source organization:
World Bank staff estimates based on IMF balance of payments data.
Categories, topics:
Economy & Growth, Financial Sector
Last updated:
apr 23, 2017
Indicators value changes by year
Minimum:
3.329 mln
jan 1, 1973
Maximum:
9.59 bln
jan 1, 2016
At the date of observation
Value
Absolute change
Change from previous value
jan 1, 1972
5.442 mln
+5.442 mln
0.0%
jan 1, 1973
3.329 mln
-2.113 mln
-38.83%
jan 1, 1974
8.154 mln
+4.826 mln
144.97%
jan 1, 1975
97.429 mln
+89.274 mln
1.09K%
jan 1, 1976
399.195 mln
+301.766 mln
309.73%
jan 1, 1977
552.825 mln
+153.631 mln
38.49%
jan 1, 1978
888.131 mln
+335.305 mln
60.65%
jan 1, 1979
1.204 bln
+315.668 mln
35.54%
jan 1, 1980
1.722 bln
+518.581 mln
43.08%
jan 1, 1981
2.243 bln
+520.788 mln
30.24%
jan 1, 1982
1.854 bln
-389.412 mln
-17.36%
jan 1, 1983
1.691 bln
-162.694 mln
-8.78%
jan 1, 1984
1.608 bln
-82.755 mln
-4.89%
jan 1, 1985
1.414 bln
-194.457 mln
-12.09%
jan 1, 1986
1.353 bln
-60.872 mln
-4.31%
jan 1, 1987
1.536 bln
+183.381 mln
13.55%
jan 1, 1988
1.491 bln
-44.915 mln
-2.92%
jan 1, 1989
1.477 bln
-14.519 mln
-0.97%
jan 1, 1990
1.266 bln
-210.748 mln
-14.27%
jan 1, 1991
1.415 bln
+149.239 mln
11.79%
jan 1, 1992
1.417 bln
+1.85 mln
0.13%
jan 1, 1993
1.452 bln
+34.301 mln
2.42%
jan 1, 1994
1.425 bln
-26.818 mln
-1.85%
jan 1, 1995
1.139 bln
-285.862 mln
-20.06%
jan 1, 1996
1.217 bln
+77.89 mln
6.84%
jan 1, 1997
1.398 bln
+181.255 mln
14.9%
jan 1, 1998
1.414 bln
+15.876 mln
1.14%
jan 1, 1999
1.571 bln
+157.33 mln
11.13%
jan 1, 2000
1.806 bln
+235.017 mln
14.96%
jan 1, 2001
1.699 bln
-107.212 mln
-5.94%
jan 1, 2002
1.833 bln
+133.514 mln
7.86%
jan 1, 2003
2.173 bln
+340.561 mln
18.58%
jan 1, 2004
2.381 bln
+208.105 mln
9.58%
jan 1, 2005
2.844 bln
+462.671 mln
19.43%
jan 1, 2006
3.23 bln
+386.477 mln
13.59%
jan 1, 2007
4.077 bln
+846.8 mln
26.21%
jan 1, 2008
4.495 bln
+417.431 mln
10.24%
jan 1, 2009
5.328 bln
+833.621 mln
18.55%
jan 1, 2010
5.675 bln
+346.317 mln
6.5%
jan 1, 2011
6.587 bln
+912.927 mln
16.09%
jan 1, 2012
6.72 bln
+132.632 mln
2.01%
jan 1, 2013
7.884 bln
+1.164 bln
17.32%
jan 1, 2014
8.65 bln
+765.988 mln
9.72%
jan 1, 2015
7.435 bln
-1.215 bln
-14.05%
jan 1, 2016
9.59 bln
+2.155 bln
28.98%
Ranking of countries by current statistics by years


Comments: