29
/
en
AIzaSyAYiBZKx7MnpbEhh9jyipgxe19OcubqV5w
April 1, 2024
52152
North America
NAC
false
2
1
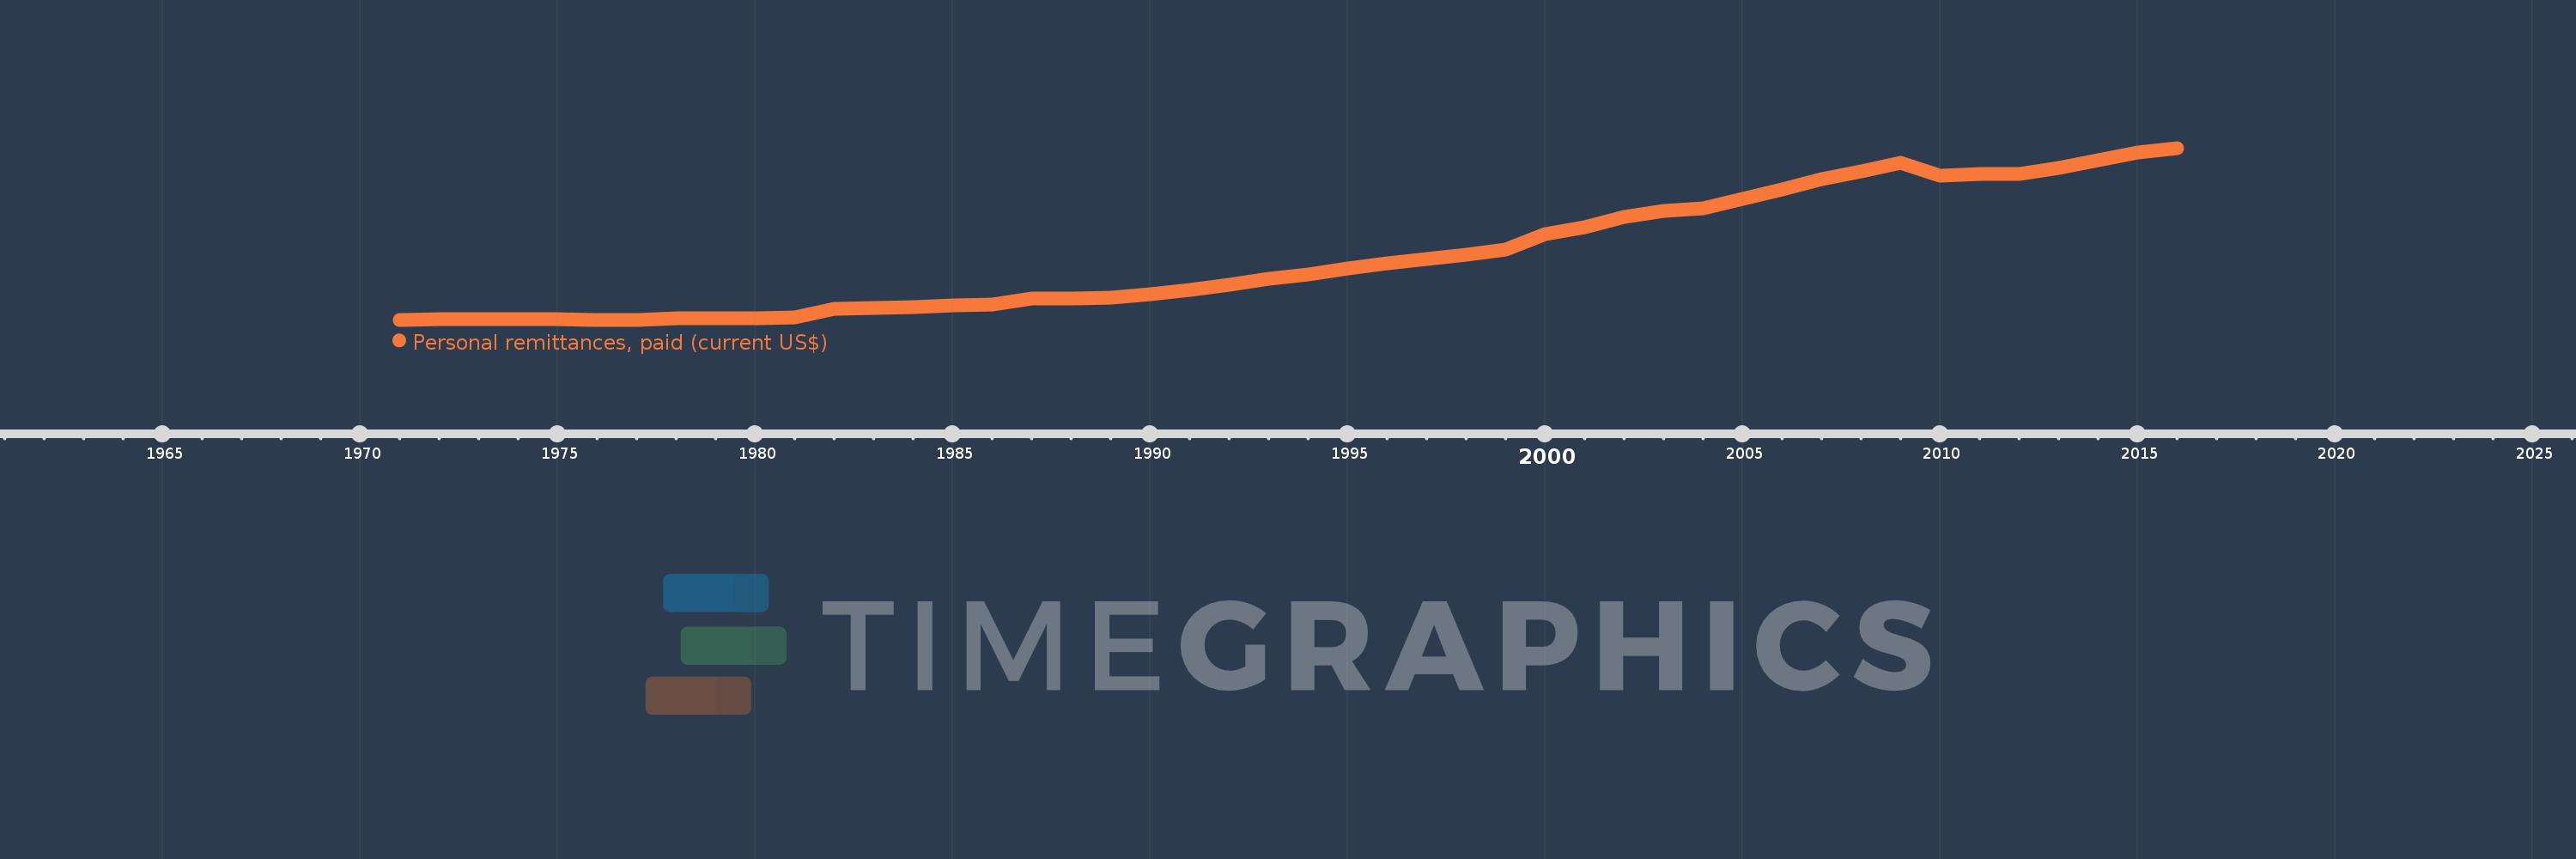
Personal remittances, paid (current US$)
2016,2015,2014,2013,2012,2011,2010,2009,2008,2007,2006,2005,2004,2003,2002,2001,2000,1999,1998,1997,1996,1995,1994,1993,1992,1991,1990,1989,1988,1987,1986,1985,1984,1983,1982,1981,1980,1979,1978,1977,1976,1975,1974,1973,1972,1971
This statistics in other country:
AfghanistanAlbaniaAlgeriaAngolaAntigua and BarbudaArab WorldArgentinaArmeniaArubaAustraliaAustriaAzerbaijanBahamas, TheBahrainBangladeshBarbadosBelarusBelgiumBelizeBeninBermudaBhutanBoliviaBosnia and HerzegovinaBotswanaBrazilBrunei DarussalamBulgariaBurkina FasoBurundiCabo VerdeCambodiaCameroonCanadaCaribbean small statesCentral African RepublicCentral Europe and the BalticsChadChileChinaColombiaComorosCongo, Dem. Rep.Congo, Rep.Costa RicaCote d'IvoireCroatiaCuracaoCyprusCzech RepublicDenmarkDjiboutiDominicaDominican RepublicEarly-demographic dividendEast Asia & PacificEast Asia & Pacific (excluding high income)East Asia & Pacific (IDA & IBRD countries)EcuadorEgypt, Arab Rep.El SalvadorEquatorial GuineaEritreaEstoniaEthiopiaEuro areaEurope & Central AsiaEurope & Central Asia (excluding high income)Europe & Central Asia (IDA & IBRD countries)European UnionFaroe IslandsFijiFinlandFragile and conflict affected situationsFranceFrench PolynesiaGabonGambia, TheGeorgiaGermanyGhanaGreeceGrenadaGuatemalaGuineaGuinea-BissauGuyanaHaitiHeavily indebted poor countries (HIPC)High incomeHondurasHong Kong SAR, ChinaHungaryIBRD onlyIcelandIDA & IBRD totalIDA blendIDA onlyIDA totalIndiaIndonesiaIraqIrelandIsraelItalyJamaicaJapanJordanKazakhstanKenyaKiribatiKorea, Rep.KosovoKuwaitKyrgyz RepublicLao PDRLate-demographic dividendLatin America & Caribbean Latin America & Caribbean (excluding high income)Latin America & the Caribbean (IDA & IBRD countries)LatviaLeast developed countries: UN classificationLebanonLesothoLiberiaLibyaLithuaniaLow & middle incomeLow incomeLower middle incomeLuxembourgMacao SAR, ChinaMacedonia, FYRMadagascarMalawiMalaysiaMaldivesMaliMaltaMarshall IslandsMauritaniaMauritiusMexicoMicronesia, Fed. Sts.Middle East & North AfricaMiddle East & North Africa (excluding high income)Middle East & North Africa (IDA & IBRD countries)Middle incomeMoldovaMongoliaMontenegroMoroccoMozambiqueMyanmarNamibiaNepalNetherlandsNew CaledoniaNew ZealandNicaraguaNigerNigeriaNorth AmericaNorwayOECD membersOmanOther small statesPacific island small statesPakistanPalauPanamaPapua New GuineaParaguayPeruPhilippinesPolandPortugalPost-demographic dividendPre-demographic dividendQatarRomaniaRussian FederationRwandaSamoaSao Tome and PrincipeSaudi ArabiaSenegalSerbiaSeychellesSierra LeoneSint Maarten (Dutch part)Slovak RepublicSloveniaSmall statesSolomon IslandsSomaliaSouth AfricaSouth AsiaSouth Asia (IDA & IBRD)South SudanSpainSri LankaSt. Kitts and NevisSt. LuciaSt. Vincent and the GrenadinesSub-Saharan Africa Sub-Saharan Africa (excluding high income)Sub-Saharan Africa (IDA & IBRD countries)SudanSurinameSwazilandSwedenSwitzerlandSyrian Arab RepublicTajikistanTanzaniaThailandTimor-LesteTogoTongaTrinidad and TobagoTunisiaTurkeyTurkmenistanTuvaluUgandaUkraineUnited KingdomUnited StatesUpper middle incomeUruguayVanuatuVenezuela, RBVietnamWest Bank and GazaWorldYemen, Rep.ZambiaZimbabwe Timeline:
This timeline shows a graph from 1971 to 2016 of North America. No data until 1970. Number of actual observations by date: 46.
Source name:
World Development Indicators
Source organization:
World Bank staff estimates based on IMF balance of payments data.
Categories, topics:
Economy & Growth, Financial Sector
Last updated:
apr 23, 2017
Indicators value changes by year
Minimum:
590.0 mln
jan 1, 1976
Maximum:
66.301 bln
jan 1, 2016
At the date of observation
Value
Absolute change
Change from previous value
jan 1, 1971
650.0 mln
+650.0 mln
0.0%
jan 1, 1972
700.0 mln
+50.0 mln
7.69%
jan 1, 1973
670.0 mln
-30.0 mln
-4.29%
jan 1, 1974
710.0 mln
+40.0 mln
5.97%
jan 1, 1975
680.0 mln
-30.0 mln
-4.23%
jan 1, 1976
590.0 mln
-90.0 mln
-13.24%
jan 1, 1977
650.0 mln
+60.0 mln
10.17%
jan 1, 1978
1.06 bln
+410.0 mln
63.08%
jan 1, 1979
1.17 bln
+110.0 mln
10.38%
jan 1, 1980
1.22 bln
+50.0 mln
4.27%
jan 1, 1981
1.36 bln
+140.0 mln
11.48%
jan 1, 1982
4.72 bln
+3.36 bln
247.06%
jan 1, 1983
5.14 bln
+420.0 mln
8.9%
jan 1, 1984
5.45 bln
+310.0 mln
6.03%
jan 1, 1985
5.99 bln
+540.0 mln
9.91%
jan 1, 1986
6.33 bln
+340.0 mln
5.68%
jan 1, 1987
8.66 bln
+2.33 bln
36.81%
jan 1, 1988
8.806 bln
+146.0 mln
1.69%
jan 1, 1989
9.005 bln
+199.0 mln
2.26%
jan 1, 1990
10.22 bln
+1.215 bln
13.49%
jan 1, 1991
11.85 bln
+1.63 bln
15.95%
jan 1, 1992
13.919 bln
+2.069 bln
17.46%
jan 1, 1993
16.156 bln
+2.237 bln
16.07%
jan 1, 1994
18.041 bln
+1.885 bln
11.67%
jan 1, 1995
20.366 bln
+2.325 bln
12.88%
jan 1, 1996
22.181 bln
+1.816 bln
8.92%
jan 1, 1997
23.723 bln
+1.542 bln
6.95%
jan 1, 1998
25.594 bln
+1.87 bln
7.88%
jan 1, 1999
27.427 bln
+1.833 bln
7.16%
jan 1, 2000
33.346 bln
+5.92 bln
21.58%
jan 1, 2001
36.094 bln
+2.748 bln
8.24%
jan 1, 2002
39.994 bln
+3.9 bln
10.81%
jan 1, 2003
42.081 bln
+2.087 bln
5.22%
jan 1, 2004
43.185 bln
+1.104 bln
2.62%
jan 1, 2005
46.968 bln
+3.783 bln
8.76%
jan 1, 2006
50.515 bln
+3.546 bln
7.55%
jan 1, 2007
54.214 bln
+3.7 bln
7.32%
jan 1, 2008
57.395 bln
+3.18 bln
5.87%
jan 1, 2009
60.577 bln
+3.183 bln
5.55%
jan 1, 2010
55.593 bln
-4.984 bln
-8.23%
jan 1, 2011
56.305 bln
+712.003 mln
1.28%
jan 1, 2012
56.328 bln
+22.752 mln
0.04%
jan 1, 2013
58.5 bln
+2.172 bln
3.86%
jan 1, 2014
61.592 bln
+3.093 bln
5.29%
jan 1, 2015
64.46 bln
+2.868 bln
4.66%
jan 1, 2016
66.301 bln
+1.841 bln
2.86%
Ranking of countries by current statistics by years


Comments: