29
/
en
AIzaSyAYiBZKx7MnpbEhh9jyipgxe19OcubqV5w
April 1, 2024
50359
Middle East & North Africa (IDA & IBRD countries)
TMN
false
2
1
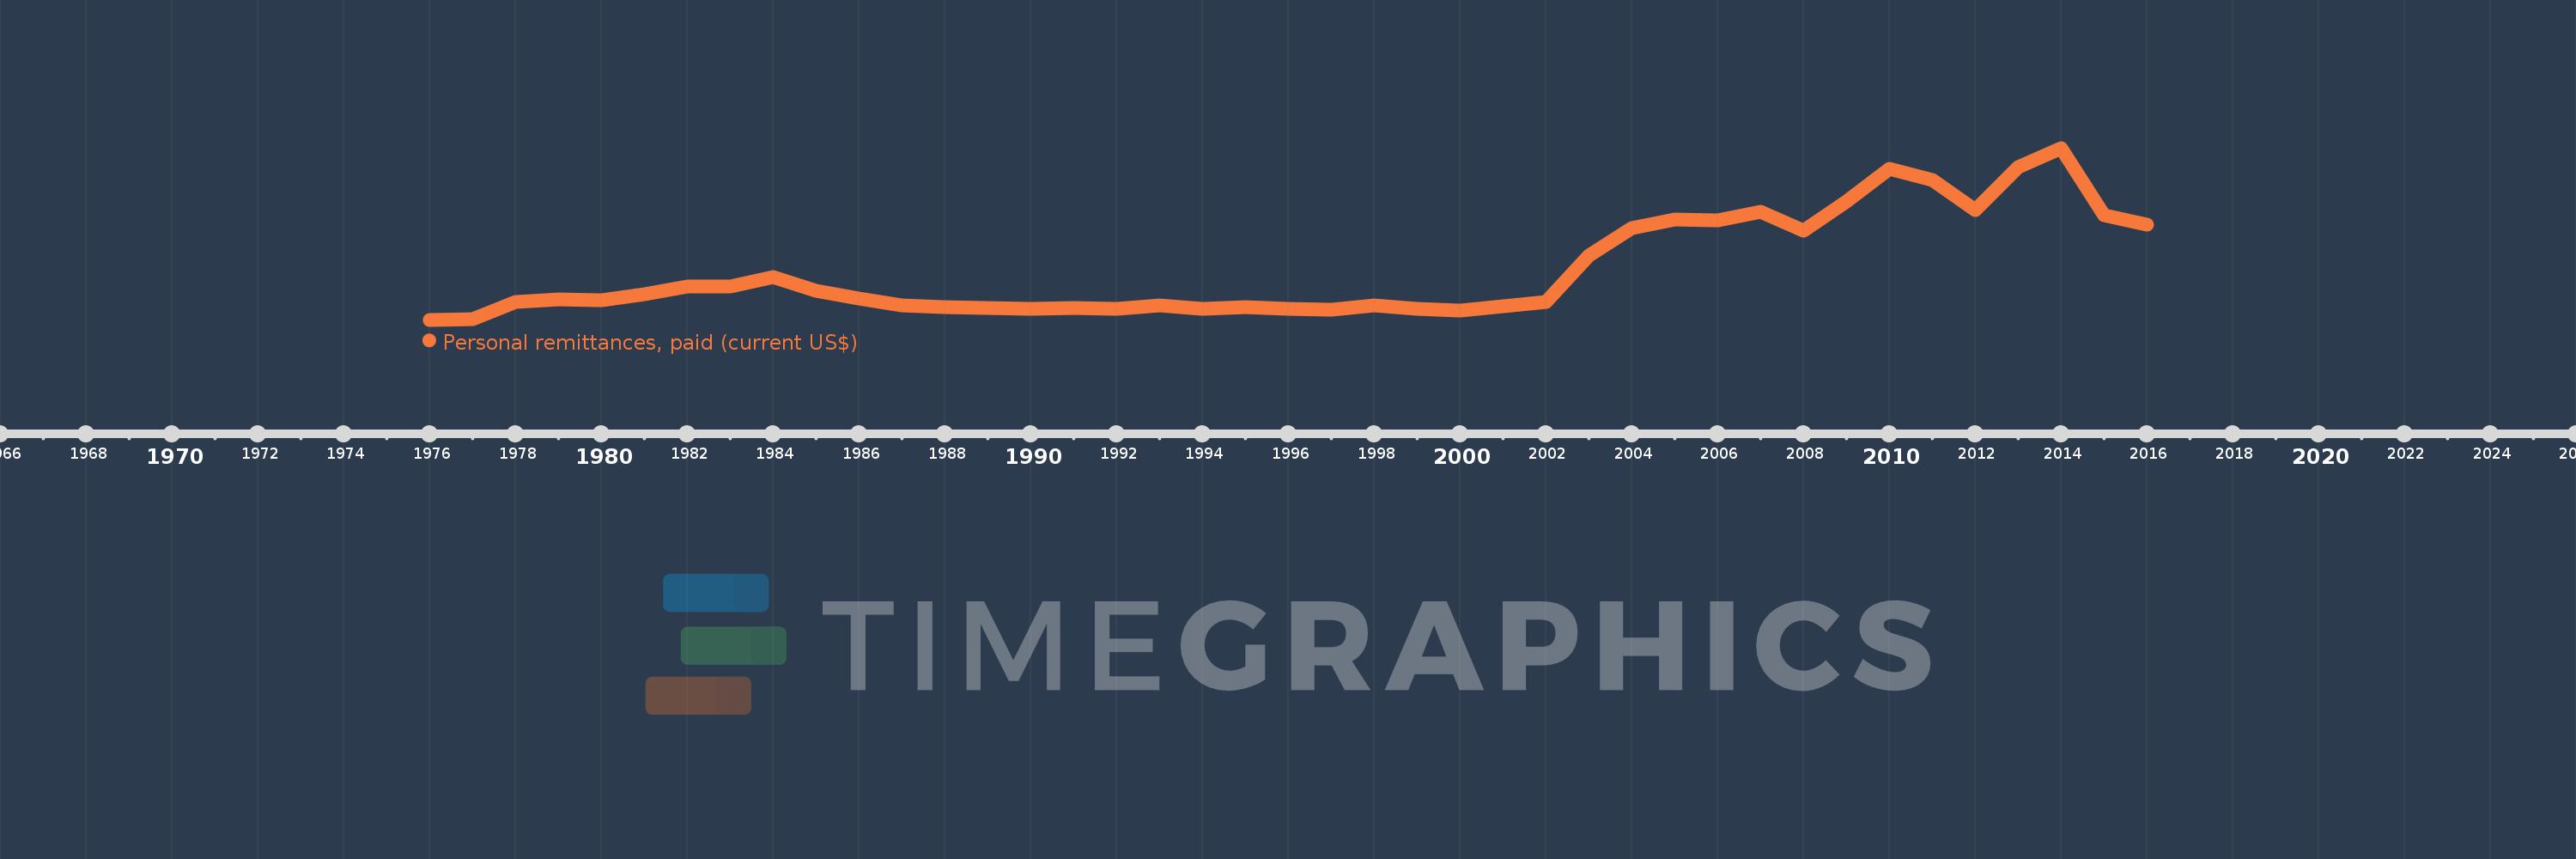
Personal remittances, paid (current US$)
2016,2015,2014,2013,2012,2011,2010,2009,2008,2007,2006,2005,2004,2003,2002,2001,2000,1999,1998,1997,1996,1995,1994,1993,1992,1991,1990,1989,1988,1987,1986,1985,1984,1983,1982,1981,1980,1979,1978,1977,1976
This statistics in other country:
AfghanistanAlbaniaAlgeriaAngolaAntigua and BarbudaArab WorldArgentinaArmeniaArubaAustraliaAustriaAzerbaijanBahamas, TheBahrainBangladeshBarbadosBelarusBelgiumBelizeBeninBermudaBhutanBoliviaBosnia and HerzegovinaBotswanaBrazilBrunei DarussalamBulgariaBurkina FasoBurundiCabo VerdeCambodiaCameroonCanadaCaribbean small statesCentral African RepublicCentral Europe and the BalticsChadChileChinaColombiaComorosCongo, Dem. Rep.Congo, Rep.Costa RicaCote d'IvoireCroatiaCuracaoCyprusCzech RepublicDenmarkDjiboutiDominicaDominican RepublicEarly-demographic dividendEast Asia & PacificEast Asia & Pacific (excluding high income)East Asia & Pacific (IDA & IBRD countries)EcuadorEgypt, Arab Rep.El SalvadorEquatorial GuineaEritreaEstoniaEthiopiaEuro areaEurope & Central AsiaEurope & Central Asia (excluding high income)Europe & Central Asia (IDA & IBRD countries)European UnionFaroe IslandsFijiFinlandFragile and conflict affected situationsFranceFrench PolynesiaGabonGambia, TheGeorgiaGermanyGhanaGreeceGrenadaGuatemalaGuineaGuinea-BissauGuyanaHaitiHeavily indebted poor countries (HIPC)High incomeHondurasHong Kong SAR, ChinaHungaryIBRD onlyIcelandIDA & IBRD totalIDA blendIDA onlyIDA totalIndiaIndonesiaIraqIrelandIsraelItalyJamaicaJapanJordanKazakhstanKenyaKiribatiKorea, Rep.KosovoKuwaitKyrgyz RepublicLao PDRLate-demographic dividendLatin America & Caribbean Latin America & Caribbean (excluding high income)Latin America & the Caribbean (IDA & IBRD countries)LatviaLeast developed countries: UN classificationLebanonLesothoLiberiaLibyaLithuaniaLow & middle incomeLow incomeLower middle incomeLuxembourgMacao SAR, ChinaMacedonia, FYRMadagascarMalawiMalaysiaMaldivesMaliMaltaMarshall IslandsMauritaniaMauritiusMexicoMicronesia, Fed. Sts.Middle East & North AfricaMiddle East & North Africa (excluding high income)Middle East & North Africa (IDA & IBRD countries)Middle incomeMoldovaMongoliaMontenegroMoroccoMozambiqueMyanmarNamibiaNepalNetherlandsNew CaledoniaNew ZealandNicaraguaNigerNigeriaNorth AmericaNorwayOECD membersOmanOther small statesPacific island small statesPakistanPalauPanamaPapua New GuineaParaguayPeruPhilippinesPolandPortugalPost-demographic dividendPre-demographic dividendQatarRomaniaRussian FederationRwandaSamoaSao Tome and PrincipeSaudi ArabiaSenegalSerbiaSeychellesSierra LeoneSint Maarten (Dutch part)Slovak RepublicSloveniaSmall statesSolomon IslandsSomaliaSouth AfricaSouth AsiaSouth Asia (IDA & IBRD)South SudanSpainSri LankaSt. Kitts and NevisSt. LuciaSt. Vincent and the GrenadinesSub-Saharan Africa Sub-Saharan Africa (excluding high income)Sub-Saharan Africa (IDA & IBRD countries)SudanSurinameSwazilandSwedenSwitzerlandSyrian Arab RepublicTajikistanTanzaniaThailandTimor-LesteTogoTongaTrinidad and TobagoTunisiaTurkeyTurkmenistanTuvaluUgandaUkraineUnited KingdomUnited StatesUpper middle incomeUruguayVanuatuVenezuela, RBVietnamWest Bank and GazaWorldYemen, Rep.ZambiaZimbabwe Timeline:
This timeline shows a graph from 1976 to 2016 of Middle East & North Africa (IDA & IBRD countries). No data until 1975. Number of actual observations by date: 41.
Source name:
World Development Indicators
Source organization:
World Bank staff estimates based on IMF balance of payments data.
Categories, topics:
Economy & Growth, Financial Sector
Last updated:
apr 23, 2017
Indicators value changes by year
Minimum:
53.301 mln
jan 1, 1976
Maximum:
9.75 bln
jan 1, 2014
At the date of observation
Value
Absolute change
Change from previous value
jan 1, 1976
53.301 mln
+53.301 mln
0.0%
jan 1, 1977
99.174 mln
+45.874 mln
86.07%
jan 1, 1978
1.054 bln
+954.682 mln
962.63%
jan 1, 1979
1.215 bln
+160.699 mln
15.25%
jan 1, 1980
1.146 bln
-68.271 mln
-5.62%
jan 1, 1981
1.471 bln
+324.717 mln
28.33%
jan 1, 1982
1.919 bln
+448.395 mln
30.48%
jan 1, 1983
1.941 bln
+21.867 mln
1.14%
jan 1, 1984
2.443 bln
+501.996 mln
25.86%
jan 1, 1985
1.682 bln
-761.648 mln
-31.17%
jan 1, 1986
1.264 bln
-417.853 mln
-24.85%
jan 1, 1987
865.859 mln
-397.899 mln
-31.49%
jan 1, 1988
766.637 mln
-99.222 mln
-11.46%
jan 1, 1989
731.55 mln
-35.088 mln
-4.58%
jan 1, 1990
657.982 mln
-73.568 mln
-10.06%
jan 1, 1991
709.094 mln
+51.112 mln
7.77%
jan 1, 1992
683.571 mln
-25.523 mln
-3.6%
jan 1, 1993
848.466 mln
+164.895 mln
24.12%
jan 1, 1994
679.475 mln
-168.991 mln
-19.92%
jan 1, 1995
745.687 mln
+66.212 mln
9.74%
jan 1, 1996
684.636 mln
-61.051 mln
-8.19%
jan 1, 1997
632.457 mln
-52.18 mln
-7.62%
jan 1, 1998
860.916 mln
+228.46 mln
36.12%
jan 1, 1999
657.812 mln
-203.104 mln
-23.59%
jan 1, 2000
561.796 mln
-96.016 mln
-14.6%
jan 1, 2001
828.082 mln
+266.287 mln
47.4%
jan 1, 2002
1.054 bln
+225.724 mln
27.26%
jan 1, 2003
3.659 bln
+2.605 bln
247.24%
jan 1, 2004
5.219 bln
+1.56 bln
42.63%
jan 1, 2005
5.694 bln
+474.769 mln
9.1%
jan 1, 2006
5.646 bln
-47.536 mln
-0.83%
jan 1, 2007
6.158 bln
+511.027 mln
9.05%
jan 1, 2008
5.086 bln
-1.071 bln
-17.4%
jan 1, 2009
6.723 bln
+1.637 bln
32.19%
jan 1, 2010
8.566 bln
+1.843 bln
27.41%
jan 1, 2011
7.941 bln
-625.132 mln
-7.3%
jan 1, 2012
6.265 bln
-1.676 bln
-21.11%
jan 1, 2013
8.672 bln
+2.407 bln
38.42%
jan 1, 2014
9.75 bln
+1.078 bln
12.43%
jan 1, 2015
5.94 bln
-3.81 bln
-39.08%
jan 1, 2016
5.432 bln
-507.703 mln
-8.55%
Ranking of countries by current statistics by years


Comments: