29
/
en
AIzaSyAYiBZKx7MnpbEhh9jyipgxe19OcubqV5w
April 1, 2024
125287
Egypt, Arab Rep.
EGY
true
2
1
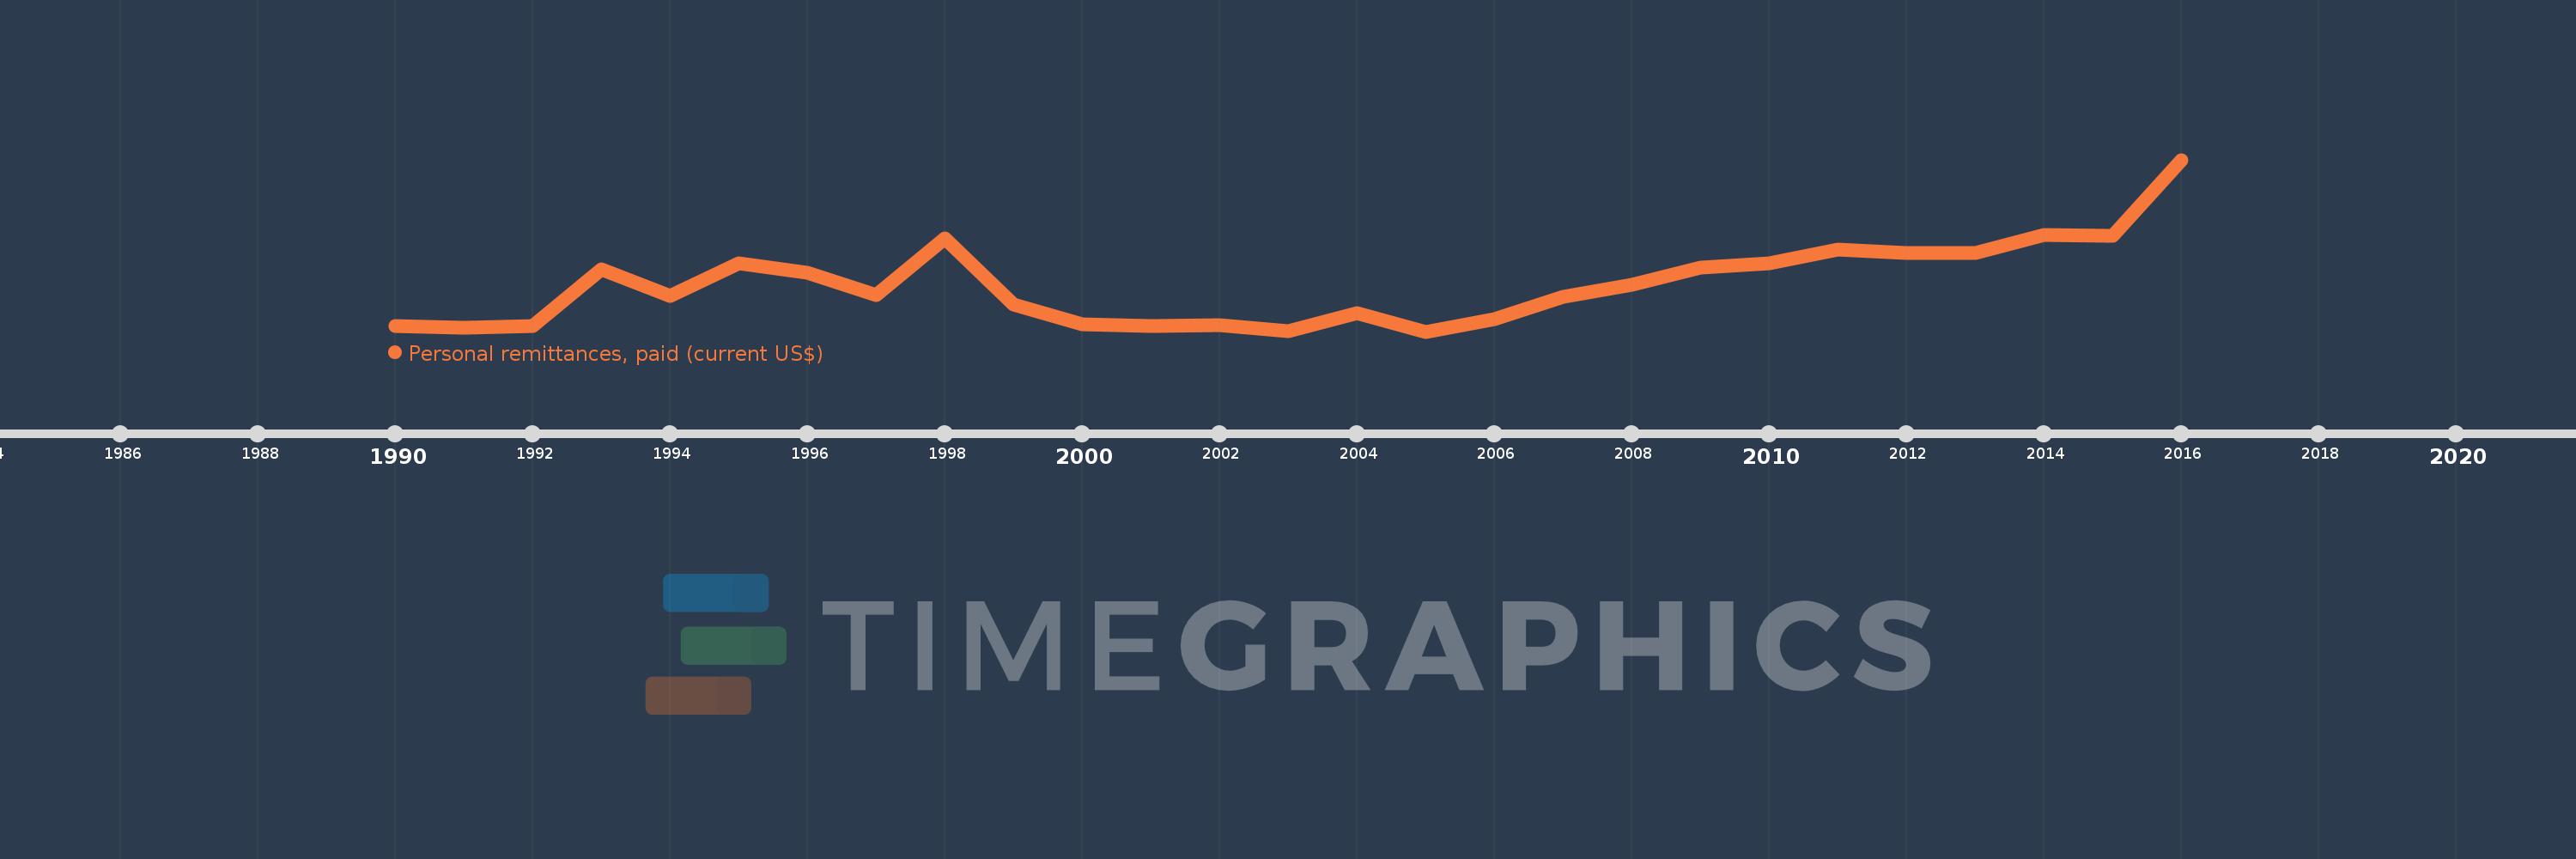
Personal remittances, paid (current US$)
2016,2015,2014,2013,2012,2011,2010,2009,2008,2007,2006,2005,2004,2003,2002,2001,2000,1999,1998,1997,1996,1995,1994,1993,1992,1991,1990
This statistics in other country:
AfghanistanAlbaniaAlgeriaAngolaAntigua and BarbudaArab WorldArgentinaArmeniaArubaAustraliaAustriaAzerbaijanBahamas, TheBahrainBangladeshBarbadosBelarusBelgiumBelizeBeninBermudaBhutanBoliviaBosnia and HerzegovinaBotswanaBrazilBrunei DarussalamBulgariaBurkina FasoBurundiCabo VerdeCambodiaCameroonCanadaCaribbean small statesCentral African RepublicCentral Europe and the BalticsChadChileChinaColombiaComorosCongo, Dem. Rep.Congo, Rep.Costa RicaCote d'IvoireCroatiaCuracaoCyprusCzech RepublicDenmarkDjiboutiDominicaDominican RepublicEarly-demographic dividendEast Asia & PacificEast Asia & Pacific (excluding high income)East Asia & Pacific (IDA & IBRD countries)EcuadorEgypt, Arab Rep.El SalvadorEquatorial GuineaEritreaEstoniaEthiopiaEuro areaEurope & Central AsiaEurope & Central Asia (excluding high income)Europe & Central Asia (IDA & IBRD countries)European UnionFaroe IslandsFijiFinlandFragile and conflict affected situationsFranceFrench PolynesiaGabonGambia, TheGeorgiaGermanyGhanaGreeceGrenadaGuatemalaGuineaGuinea-BissauGuyanaHaitiHeavily indebted poor countries (HIPC)High incomeHondurasHong Kong SAR, ChinaHungaryIBRD onlyIcelandIDA & IBRD totalIDA blendIDA onlyIDA totalIndiaIndonesiaIraqIrelandIsraelItalyJamaicaJapanJordanKazakhstanKenyaKiribatiKorea, Rep.KosovoKuwaitKyrgyz RepublicLao PDRLate-demographic dividendLatin America & Caribbean Latin America & Caribbean (excluding high income)Latin America & the Caribbean (IDA & IBRD countries)LatviaLeast developed countries: UN classificationLebanonLesothoLiberiaLibyaLithuaniaLow & middle incomeLow incomeLower middle incomeLuxembourgMacao SAR, ChinaMacedonia, FYRMadagascarMalawiMalaysiaMaldivesMaliMaltaMarshall IslandsMauritaniaMauritiusMexicoMicronesia, Fed. Sts.Middle East & North AfricaMiddle East & North Africa (excluding high income)Middle East & North Africa (IDA & IBRD countries)Middle incomeMoldovaMongoliaMontenegroMoroccoMozambiqueMyanmarNamibiaNepalNetherlandsNew CaledoniaNew ZealandNicaraguaNigerNigeriaNorth AmericaNorwayOECD membersOmanOther small statesPacific island small statesPakistanPalauPanamaPapua New GuineaParaguayPeruPhilippinesPolandPortugalPost-demographic dividendPre-demographic dividendQatarRomaniaRussian FederationRwandaSamoaSao Tome and PrincipeSaudi ArabiaSenegalSerbiaSeychellesSierra LeoneSint Maarten (Dutch part)Slovak RepublicSloveniaSmall statesSolomon IslandsSomaliaSouth AfricaSouth AsiaSouth Asia (IDA & IBRD)South SudanSpainSri LankaSt. Kitts and NevisSt. LuciaSt. Vincent and the GrenadinesSub-Saharan Africa Sub-Saharan Africa (excluding high income)Sub-Saharan Africa (IDA & IBRD countries)SudanSurinameSwazilandSwedenSwitzerlandSyrian Arab RepublicTajikistanTanzaniaThailandTimor-LesteTogoTongaTrinidad and TobagoTunisiaTurkeyTurkmenistanTuvaluUgandaUkraineUnited KingdomUnited StatesUpper middle incomeUruguayVanuatuVenezuela, RBVietnamWest Bank and GazaWorldYemen, Rep.ZambiaZimbabwe Timeline:
This timeline shows a graph from 1990 to 2016 of Egypt, Arab Rep.. No data until 1989. Number of actual observations by date: 27.
Source name:
World Development Indicators
Source organization:
World Bank staff estimates based on IMF balance of payments data.
Categories, topics:
Economy & Growth, Financial Sector
Last updated:
apr 23, 2017
Indicators value changes by year
Minimum:
12.8 mln
jan 1, 2005
Maximum:
622.7 mln
jan 1, 2016
At the date of observation
Value
Absolute change
Change from previous value
jan 1, 1990
33.182 mln
+33.182 mln
0.0%
jan 1, 1991
26.5 mln
-6.682 mln
-20.14%
jan 1, 1992
33.0 mln
+6.5 mln
24.53%
jan 1, 1993
233.0 mln
+200.0 mln
606.06%
jan 1, 1994
140.0 mln
-93.0 mln
-39.91%
jan 1, 1995
255.0 mln
+115.0 mln
82.14%
jan 1, 1996
223.0 mln
-32.0 mln
-12.55%
jan 1, 1997
142.0 mln
-81.0 mln
-36.32%
jan 1, 1998
344.2 mln
+202.2 mln
142.39%
jan 1, 1999
108.0 mln
-236.2 mln
-68.62%
jan 1, 2000
38.8 mln
-69.2 mln
-64.07%
jan 1, 2001
32.0 mln
-6.8 mln
-17.53%
jan 1, 2002
34.7 mln
+2.7 mln
8.44%
jan 1, 2003
14.4 mln
-20.3 mln
-58.5%
jan 1, 2004
79.1 mln
+64.7 mln
449.31%
jan 1, 2005
12.8 mln
-66.3 mln
-83.82%
jan 1, 2006
57.2 mln
+44.4 mln
346.88%
jan 1, 2007
135.0 mln
+77.8 mln
136.01%
jan 1, 2008
179.6 mln
+44.6 mln
33.04%
jan 1, 2009
241.3 mln
+61.7 mln
34.35%
jan 1, 2010
254.8 mln
+13.5 mln
5.59%
jan 1, 2011
304.8 mln
+50.0 mln
19.62%
jan 1, 2012
292.9 mln
-11.9 mln
-3.9%
jan 1, 2013
292.7 mln
-200.0K
-0.07%
jan 1, 2014
354.9 mln
+62.2 mln
21.25%
jan 1, 2015
351.4 mln
-3.5 mln
-0.99%
jan 1, 2016
622.7 mln
+271.3 mln
77.21%
Ranking of countries by current statistics by years


Comments: