29
/
en
AIzaSyAYiBZKx7MnpbEhh9jyipgxe19OcubqV5w
April 1, 2024
164129
Japan
JPN
true
2
1
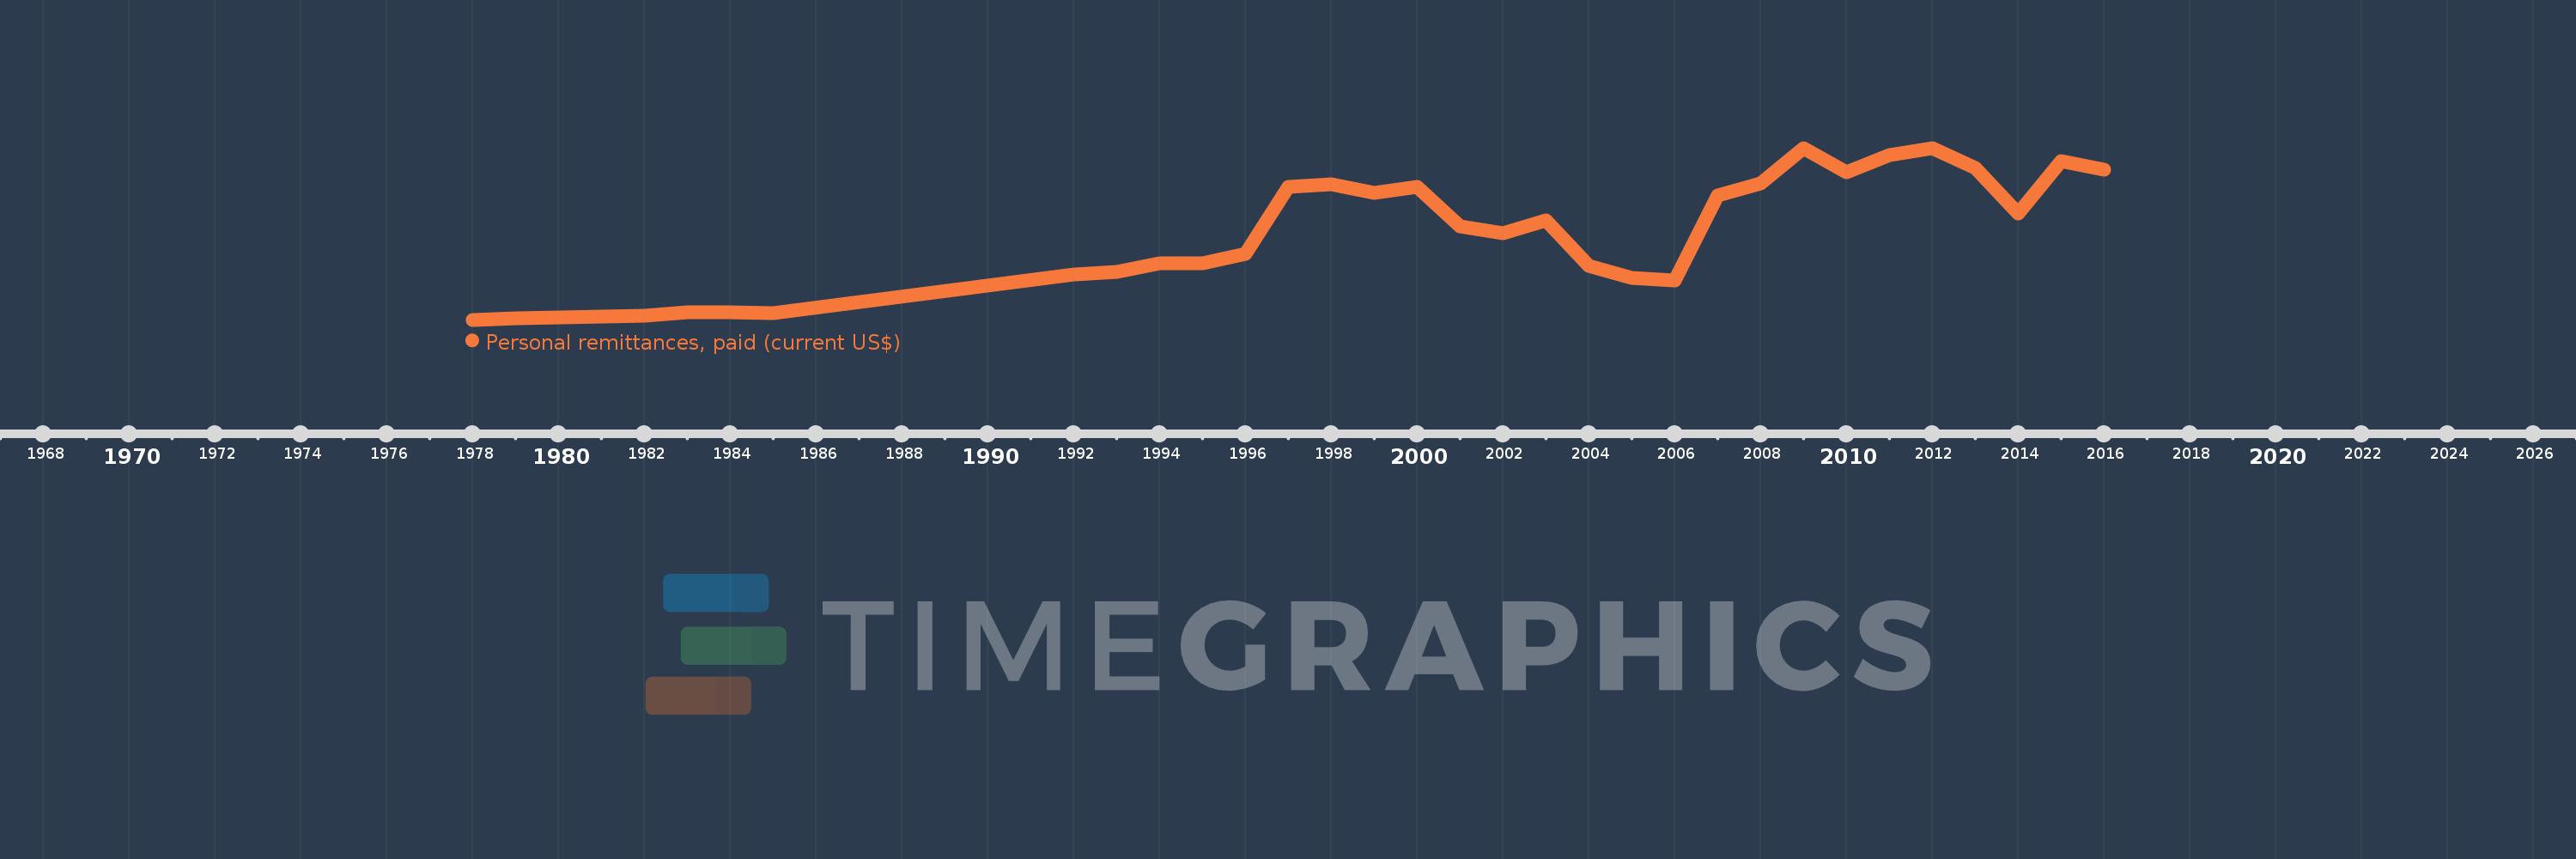
Personal remittances, paid (current US$)
2016,2015,2014,2013,2012,2011,2010,2009,2008,2007,2006,2005,2004,2003,2002,2001,2000,1999,1998,1997,1996,1995,1994,1993,1992,1985,1984,1983,1982,1981,1980,1979,1978
This statistics in other country:
AfghanistanAlbaniaAlgeriaAngolaAntigua and BarbudaArab WorldArgentinaArmeniaArubaAustraliaAustriaAzerbaijanBahamas, TheBahrainBangladeshBarbadosBelarusBelgiumBelizeBeninBermudaBhutanBoliviaBosnia and HerzegovinaBotswanaBrazilBrunei DarussalamBulgariaBurkina FasoBurundiCabo VerdeCambodiaCameroonCanadaCaribbean small statesCentral African RepublicCentral Europe and the BalticsChadChileChinaColombiaComorosCongo, Dem. Rep.Congo, Rep.Costa RicaCote d'IvoireCroatiaCuracaoCyprusCzech RepublicDenmarkDjiboutiDominicaDominican RepublicEarly-demographic dividendEast Asia & PacificEast Asia & Pacific (excluding high income)East Asia & Pacific (IDA & IBRD countries)EcuadorEgypt, Arab Rep.El SalvadorEquatorial GuineaEritreaEstoniaEthiopiaEuro areaEurope & Central AsiaEurope & Central Asia (excluding high income)Europe & Central Asia (IDA & IBRD countries)European UnionFaroe IslandsFijiFinlandFragile and conflict affected situationsFranceFrench PolynesiaGabonGambia, TheGeorgiaGermanyGhanaGreeceGrenadaGuatemalaGuineaGuinea-BissauGuyanaHaitiHeavily indebted poor countries (HIPC)High incomeHondurasHong Kong SAR, ChinaHungaryIBRD onlyIcelandIDA & IBRD totalIDA blendIDA onlyIDA totalIndiaIndonesiaIraqIrelandIsraelItalyJamaicaJapanJordanKazakhstanKenyaKiribatiKorea, Rep.KosovoKuwaitKyrgyz RepublicLao PDRLate-demographic dividendLatin America & Caribbean Latin America & Caribbean (excluding high income)Latin America & the Caribbean (IDA & IBRD countries)LatviaLeast developed countries: UN classificationLebanonLesothoLiberiaLibyaLithuaniaLow & middle incomeLow incomeLower middle incomeLuxembourgMacao SAR, ChinaMacedonia, FYRMadagascarMalawiMalaysiaMaldivesMaliMaltaMarshall IslandsMauritaniaMauritiusMexicoMicronesia, Fed. Sts.Middle East & North AfricaMiddle East & North Africa (excluding high income)Middle East & North Africa (IDA & IBRD countries)Middle incomeMoldovaMongoliaMontenegroMoroccoMozambiqueMyanmarNamibiaNepalNetherlandsNew CaledoniaNew ZealandNicaraguaNigerNigeriaNorth AmericaNorwayOECD membersOmanOther small statesPacific island small statesPakistanPalauPanamaPapua New GuineaParaguayPeruPhilippinesPolandPortugalPost-demographic dividendPre-demographic dividendQatarRomaniaRussian FederationRwandaSamoaSao Tome and PrincipeSaudi ArabiaSenegalSerbiaSeychellesSierra LeoneSint Maarten (Dutch part)Slovak RepublicSloveniaSmall statesSolomon IslandsSomaliaSouth AfricaSouth AsiaSouth Asia (IDA & IBRD)South SudanSpainSri LankaSt. Kitts and NevisSt. LuciaSt. Vincent and the GrenadinesSub-Saharan Africa Sub-Saharan Africa (excluding high income)Sub-Saharan Africa (IDA & IBRD countries)SudanSurinameSwazilandSwedenSwitzerlandSyrian Arab RepublicTajikistanTanzaniaThailandTimor-LesteTogoTongaTrinidad and TobagoTunisiaTurkeyTurkmenistanTuvaluUgandaUkraineUnited KingdomUnited StatesUpper middle incomeUruguayVanuatuVenezuela, RBVietnamWest Bank and GazaWorldYemen, Rep.ZambiaZimbabwe Timeline:
This timeline shows a graph from 1978 to 2016 of Japan. No data until 1977. Number of actual observations by date: 33.
Source name:
World Development Indicators
Source organization:
World Bank staff estimates based on IMF balance of payments data.
Categories, topics:
Economy & Growth, Financial Sector
Last updated:
apr 23, 2017
Indicators value changes by year
Minimum:
130.0 mln
jan 1, 1978
Maximum:
4.548 bln
jan 1, 2009
At the date of observation
Value
Absolute change
Change from previous value
jan 1, 1978
130.0 mln
+130.0 mln
0.0%
jan 1, 1979
160.0 mln
+30.0 mln
23.08%
jan 1, 1980
200.0 mln
+40.0 mln
25.0%
jan 1, 1981
220.0 mln
+20.0 mln
10.0%
jan 1, 1982
240.0 mln
+20.0 mln
9.09%
jan 1, 1983
330.0 mln
+90.0 mln
37.5%
jan 1, 1984
320.0 mln
-10.0 mln
-3.03%
jan 1, 1985
290.0 mln
-30.0 mln
-9.38%
jan 1, 1992
1.298 bln
+1.008 bln
347.73%
jan 1, 1993
1.371 bln
+72.836 mln
5.61%
jan 1, 1994
1.575 bln
+203.658 mln
14.85%
jan 1, 1995
1.583 bln
+7.874 mln
0.5%
jan 1, 1996
1.82 bln
+237.479 mln
15.0%
jan 1, 1997
3.554 bln
+1.734 bln
95.25%
jan 1, 1998
3.621 bln
+67.219 mln
1.89%
jan 1, 1999
3.4 bln
-221.586 mln
-6.12%
jan 1, 2000
3.539 bln
+139.674 mln
4.11%
jan 1, 2001
2.531 bln
-1.009 bln
-28.5%
jan 1, 2002
2.345 bln
-185.703 mln
-7.34%
jan 1, 2003
2.679 bln
+333.732 mln
14.23%
jan 1, 2004
1.504 bln
-1.175 bln
-43.85%
jan 1, 2005
1.212 bln
-292.103 mln
-19.42%
jan 1, 2006
1.15 bln
-62.645 mln
-5.17%
jan 1, 2007
3.332 bln
+2.183 bln
189.87%
jan 1, 2008
3.639 bln
+307.207 mln
9.22%
jan 1, 2009
4.548 bln
+908.716 mln
24.97%
jan 1, 2010
3.932 bln
-616.042 mln
-13.55%
jan 1, 2011
4.366 bln
+433.668 mln
11.03%
jan 1, 2012
4.536 bln
+170.456 mln
3.9%
jan 1, 2013
4.043 bln
-493.599 mln
-10.88%
jan 1, 2014
2.872 bln
-1.17 bln
-28.95%
jan 1, 2015
4.215 bln
+1.342 bln
46.74%
jan 1, 2016
4.0 bln
-215.018 mln
-5.1%
Ranking of countries by current statistics by years


Comments: