29
/
en
AIzaSyAYiBZKx7MnpbEhh9jyipgxe19OcubqV5w
April 1, 2024
107746
Colombia
COL
true
2
1
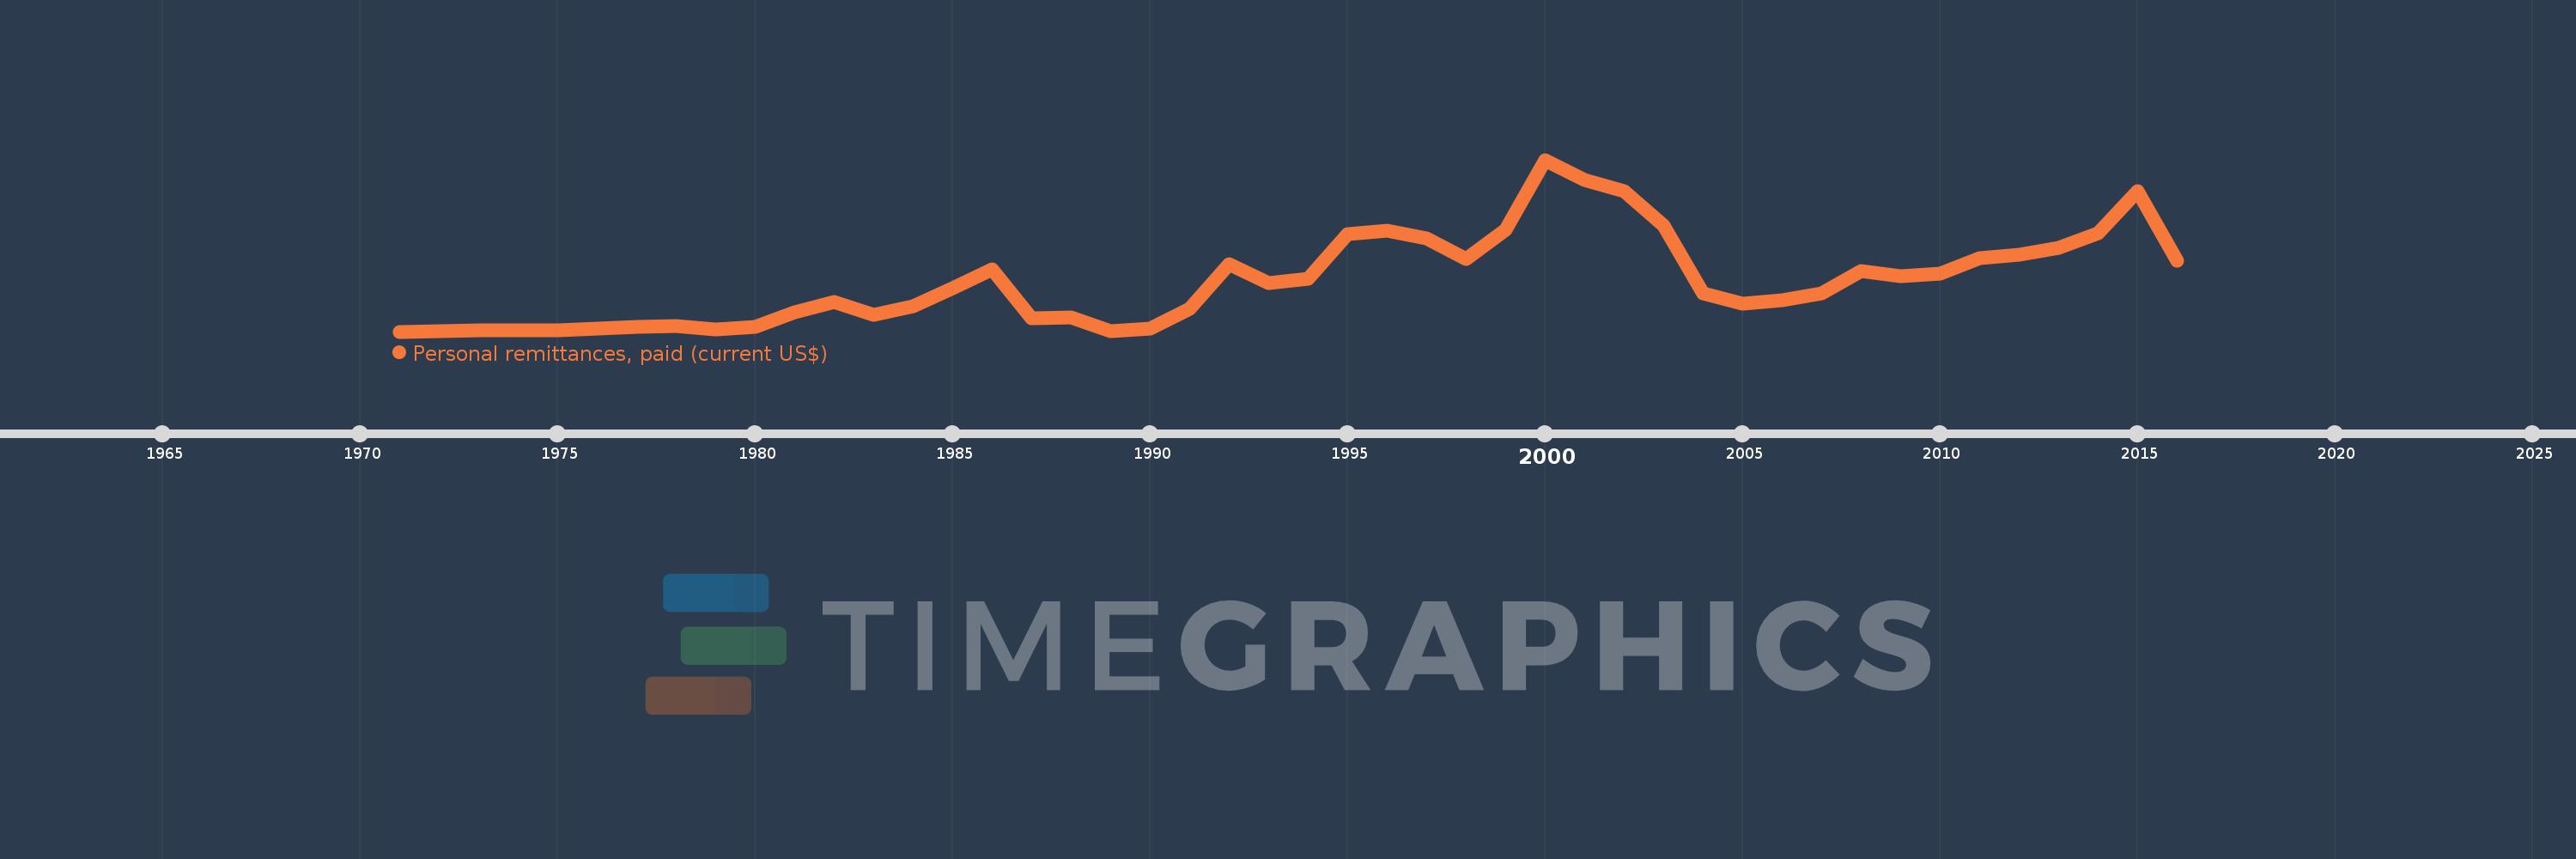
Personal remittances, paid (current US$)
2016,2015,2014,2013,2012,2011,2010,2009,2008,2007,2006,2005,2004,2003,2002,2001,2000,1999,1998,1997,1996,1995,1994,1993,1992,1991,1990,1989,1988,1987,1986,1985,1984,1983,1982,1981,1980,1979,1978,1977,1976,1975,1974,1973,1972,1971
This statistics in other country:
AfghanistanAlbaniaAlgeriaAngolaAntigua and BarbudaArab WorldArgentinaArmeniaArubaAustraliaAustriaAzerbaijanBahamas, TheBahrainBangladeshBarbadosBelarusBelgiumBelizeBeninBermudaBhutanBoliviaBosnia and HerzegovinaBotswanaBrazilBrunei DarussalamBulgariaBurkina FasoBurundiCabo VerdeCambodiaCameroonCanadaCaribbean small statesCentral African RepublicCentral Europe and the BalticsChadChileChinaColombiaComorosCongo, Dem. Rep.Congo, Rep.Costa RicaCote d'IvoireCroatiaCuracaoCyprusCzech RepublicDenmarkDjiboutiDominicaDominican RepublicEarly-demographic dividendEast Asia & PacificEast Asia & Pacific (excluding high income)East Asia & Pacific (IDA & IBRD countries)EcuadorEgypt, Arab Rep.El SalvadorEquatorial GuineaEritreaEstoniaEthiopiaEuro areaEurope & Central AsiaEurope & Central Asia (excluding high income)Europe & Central Asia (IDA & IBRD countries)European UnionFaroe IslandsFijiFinlandFragile and conflict affected situationsFranceFrench PolynesiaGabonGambia, TheGeorgiaGermanyGhanaGreeceGrenadaGuatemalaGuineaGuinea-BissauGuyanaHaitiHeavily indebted poor countries (HIPC)High incomeHondurasHong Kong SAR, ChinaHungaryIBRD onlyIcelandIDA & IBRD totalIDA blendIDA onlyIDA totalIndiaIndonesiaIraqIrelandIsraelItalyJamaicaJapanJordanKazakhstanKenyaKiribatiKorea, Rep.KosovoKuwaitKyrgyz RepublicLao PDRLate-demographic dividendLatin America & Caribbean Latin America & Caribbean (excluding high income)Latin America & the Caribbean (IDA & IBRD countries)LatviaLeast developed countries: UN classificationLebanonLesothoLiberiaLibyaLithuaniaLow & middle incomeLow incomeLower middle incomeLuxembourgMacao SAR, ChinaMacedonia, FYRMadagascarMalawiMalaysiaMaldivesMaliMaltaMarshall IslandsMauritaniaMauritiusMexicoMicronesia, Fed. Sts.Middle East & North AfricaMiddle East & North Africa (excluding high income)Middle East & North Africa (IDA & IBRD countries)Middle incomeMoldovaMongoliaMontenegroMoroccoMozambiqueMyanmarNamibiaNepalNetherlandsNew CaledoniaNew ZealandNicaraguaNigerNigeriaNorth AmericaNorwayOECD membersOmanOther small statesPacific island small statesPakistanPalauPanamaPapua New GuineaParaguayPeruPhilippinesPolandPortugalPost-demographic dividendPre-demographic dividendQatarRomaniaRussian FederationRwandaSamoaSao Tome and PrincipeSaudi ArabiaSenegalSerbiaSeychellesSierra LeoneSint Maarten (Dutch part)Slovak RepublicSloveniaSmall statesSolomon IslandsSomaliaSouth AfricaSouth AsiaSouth Asia (IDA & IBRD)South SudanSpainSri LankaSt. Kitts and NevisSt. LuciaSt. Vincent and the GrenadinesSub-Saharan Africa Sub-Saharan Africa (excluding high income)Sub-Saharan Africa (IDA & IBRD countries)SudanSurinameSwazilandSwedenSwitzerlandSyrian Arab RepublicTajikistanTanzaniaThailandTimor-LesteTogoTongaTrinidad and TobagoTunisiaTurkeyTurkmenistanTuvaluUgandaUkraineUnited KingdomUnited StatesUpper middle incomeUruguayVanuatuVenezuela, RBVietnamWest Bank and GazaWorldYemen, Rep.ZambiaZimbabwe Timeline:
This timeline shows a graph from 1971 to 2016 of Colombia. No data until 1970. Number of actual observations by date: 46.
Source name:
World Development Indicators
Source organization:
World Bank staff estimates based on IMF balance of payments data.
Categories, topics:
Economy & Growth, Financial Sector
Last updated:
apr 23, 2017
Indicators value changes by year
Minimum:
13.0 mln
jan 1, 1971
Maximum:
246.709 mln
jan 1, 2000
At the date of observation
Value
Absolute change
Change from previous value
jan 1, 1971
13.0 mln
+13.0 mln
0.0%
jan 1, 1972
13.039 mln
+38.74K
0.3%
jan 1, 1973
15.2 mln
+2.161 mln
16.58%
jan 1, 1974
14.306 mln
-894.38K
-5.88%
jan 1, 1975
14.432 mln
+126.12K
0.88%
jan 1, 1976
16.998 mln
+2.566 mln
17.78%
jan 1, 1977
19.627 mln
+2.629 mln
15.46%
jan 1, 1978
21.015 mln
+1.389 mln
7.07%
jan 1, 1979
16.0 mln
-5.015 mln
-23.87%
jan 1, 1980
20.0 mln
+4.0 mln
25.0%
jan 1, 1981
39.046 mln
+19.046 mln
95.23%
jan 1, 1982
53.062 mln
+14.016 mln
35.9%
jan 1, 1983
35.328 mln
-17.734 mln
-33.42%
jan 1, 1984
48.0 mln
+12.672 mln
35.87%
jan 1, 1985
72.0 mln
+24.0 mln
50.0%
jan 1, 1986
98.0 mln
+26.0 mln
36.11%
jan 1, 1987
31.0 mln
-67.0 mln
-68.37%
jan 1, 1988
32.0 mln
+1000.0K
3.23%
jan 1, 1989
14.0 mln
-18.0 mln
-56.25%
jan 1, 1990
17.0 mln
+3.0 mln
21.43%
jan 1, 1991
44.0 mln
+27.0 mln
158.82%
jan 1, 1992
105.0 mln
+61.0 mln
138.64%
jan 1, 1993
79.2 mln
-25.8 mln
-24.57%
jan 1, 1994
84.9 mln
+5.7 mln
7.2%
jan 1, 1995
145.657 mln
+60.757 mln
71.56%
jan 1, 1996
149.888 mln
+4.231 mln
2.9%
jan 1, 1997
140.224 mln
-9.663 mln
-6.45%
jan 1, 1998
112.029 mln
-28.195 mln
-20.11%
jan 1, 1999
151.321 mln
+39.291 mln
35.07%
jan 1, 2000
246.709 mln
+95.389 mln
63.04%
jan 1, 2001
219.136 mln
-27.574 mln
-11.18%
jan 1, 2002
204.463 mln
-14.672 mln
-6.7%
jan 1, 2003
157.548 mln
-46.915 mln
-22.95%
jan 1, 2004
64.953 mln
-92.595 mln
-58.77%
jan 1, 2005
50.533 mln
-14.42 mln
-22.2%
jan 1, 2006
56.161 mln
+5.629 mln
11.14%
jan 1, 2007
65.527 mln
+9.366 mln
16.68%
jan 1, 2008
95.057 mln
+29.53 mln
45.07%
jan 1, 2009
88.292 mln
-6.765 mln
-7.12%
jan 1, 2010
92.232 mln
+3.94 mln
4.46%
jan 1, 2011
112.354 mln
+20.123 mln
21.82%
jan 1, 2012
117.385 mln
+5.031 mln
4.48%
jan 1, 2013
127.509 mln
+10.123 mln
8.62%
jan 1, 2014
147.059 mln
+19.55 mln
15.33%
jan 1, 2015
204.017 mln
+56.958 mln
38.73%
jan 1, 2016
109.87 mln
-94.147 mln
-46.15%
Ranking of countries by current statistics by years


Comments: