29
/
en
AIzaSyAYiBZKx7MnpbEhh9jyipgxe19OcubqV5w
April 1, 2024
31986
Europe & Central Asia (excluding high income)
ECA
false
2
1
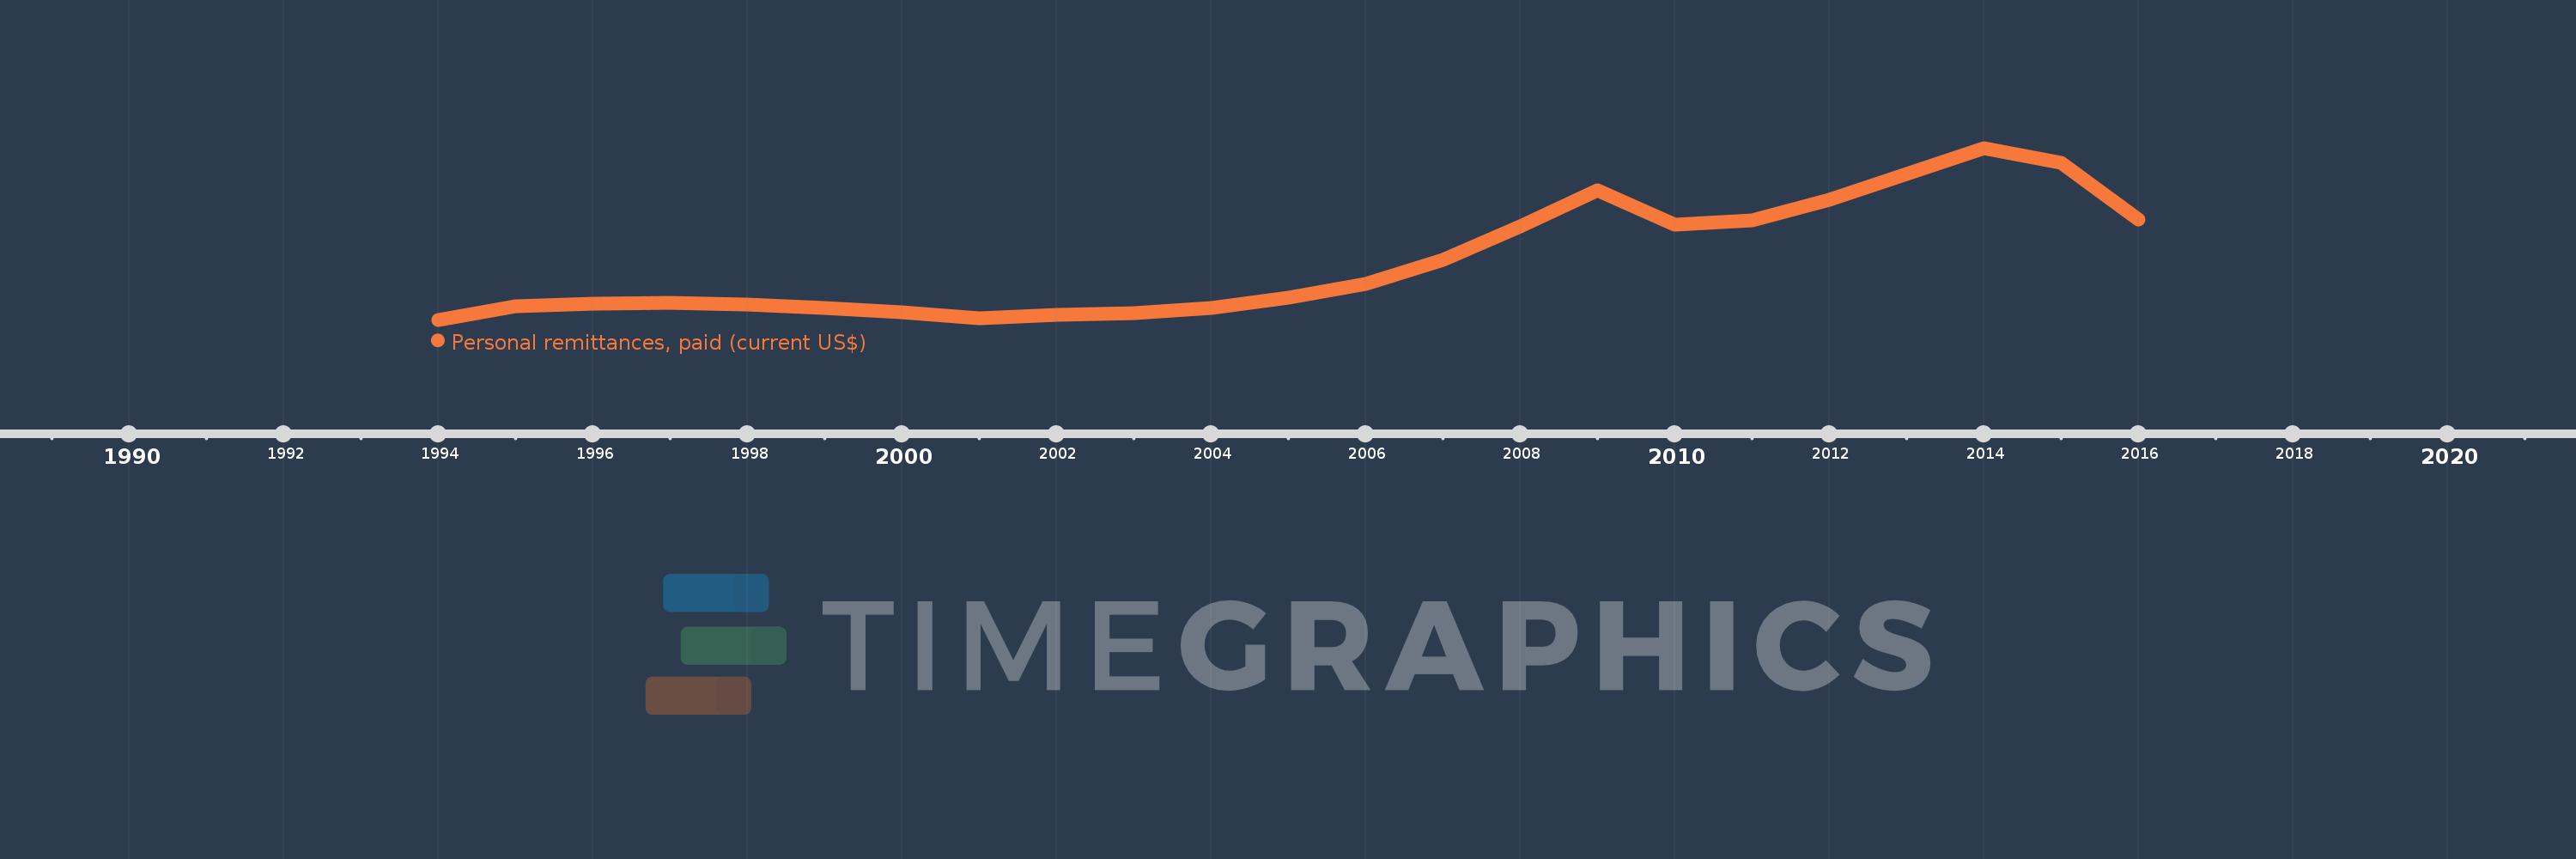
Personal remittances, paid (current US$)
2016,2015,2014,2013,2012,2011,2010,2009,2008,2007,2006,2005,2004,2003,2002,2001,2000,1999,1998,1997,1996,1995,1994
This statistics in other country:
AfghanistanAlbaniaAlgeriaAngolaAntigua and BarbudaArab WorldArgentinaArmeniaArubaAustraliaAustriaAzerbaijanBahamas, TheBahrainBangladeshBarbadosBelarusBelgiumBelizeBeninBermudaBhutanBoliviaBosnia and HerzegovinaBotswanaBrazilBrunei DarussalamBulgariaBurkina FasoBurundiCabo VerdeCambodiaCameroonCanadaCaribbean small statesCentral African RepublicCentral Europe and the BalticsChadChileChinaColombiaComorosCongo, Dem. Rep.Congo, Rep.Costa RicaCote d'IvoireCroatiaCuracaoCyprusCzech RepublicDenmarkDjiboutiDominicaDominican RepublicEarly-demographic dividendEast Asia & PacificEast Asia & Pacific (excluding high income)East Asia & Pacific (IDA & IBRD countries)EcuadorEgypt, Arab Rep.El SalvadorEquatorial GuineaEritreaEstoniaEthiopiaEuro areaEurope & Central AsiaEurope & Central Asia (excluding high income)Europe & Central Asia (IDA & IBRD countries)European UnionFaroe IslandsFijiFinlandFragile and conflict affected situationsFranceFrench PolynesiaGabonGambia, TheGeorgiaGermanyGhanaGreeceGrenadaGuatemalaGuineaGuinea-BissauGuyanaHaitiHeavily indebted poor countries (HIPC)High incomeHondurasHong Kong SAR, ChinaHungaryIBRD onlyIcelandIDA & IBRD totalIDA blendIDA onlyIDA totalIndiaIndonesiaIraqIrelandIsraelItalyJamaicaJapanJordanKazakhstanKenyaKiribatiKorea, Rep.KosovoKuwaitKyrgyz RepublicLao PDRLate-demographic dividendLatin America & Caribbean Latin America & Caribbean (excluding high income)Latin America & the Caribbean (IDA & IBRD countries)LatviaLeast developed countries: UN classificationLebanonLesothoLiberiaLibyaLithuaniaLow & middle incomeLow incomeLower middle incomeLuxembourgMacao SAR, ChinaMacedonia, FYRMadagascarMalawiMalaysiaMaldivesMaliMaltaMarshall IslandsMauritaniaMauritiusMexicoMicronesia, Fed. Sts.Middle East & North AfricaMiddle East & North Africa (excluding high income)Middle East & North Africa (IDA & IBRD countries)Middle incomeMoldovaMongoliaMontenegroMoroccoMozambiqueMyanmarNamibiaNepalNetherlandsNew CaledoniaNew ZealandNicaraguaNigerNigeriaNorth AmericaNorwayOECD membersOmanOther small statesPacific island small statesPakistanPalauPanamaPapua New GuineaParaguayPeruPhilippinesPolandPortugalPost-demographic dividendPre-demographic dividendQatarRomaniaRussian FederationRwandaSamoaSao Tome and PrincipeSaudi ArabiaSenegalSerbiaSeychellesSierra LeoneSint Maarten (Dutch part)Slovak RepublicSloveniaSmall statesSolomon IslandsSomaliaSouth AfricaSouth AsiaSouth Asia (IDA & IBRD)South SudanSpainSri LankaSt. Kitts and NevisSt. LuciaSt. Vincent and the GrenadinesSub-Saharan Africa Sub-Saharan Africa (excluding high income)Sub-Saharan Africa (IDA & IBRD countries)SudanSurinameSwazilandSwedenSwitzerlandSyrian Arab RepublicTajikistanTanzaniaThailandTimor-LesteTogoTongaTrinidad and TobagoTunisiaTurkeyTurkmenistanTuvaluUgandaUkraineUnited KingdomUnited StatesUpper middle incomeUruguayVanuatuVenezuela, RBVietnamWest Bank and GazaWorldYemen, Rep.ZambiaZimbabwe Timeline:
This timeline shows a graph from 1994 to 2016 of Europe & Central Asia (excluding high income). No data until 1993. Number of actual observations by date: 23.
Source name:
World Development Indicators
Source organization:
World Bank staff estimates based on IMF balance of payments data.
Categories, topics:
Economy & Growth, Financial Sector
Last updated:
apr 23, 2017
Indicators value changes by year
Minimum:
112.213 mln
jan 1, 1994
Maximum:
48.036 bln
jan 1, 2014
At the date of observation
Value
Absolute change
Change from previous value
jan 1, 1994
112.213 mln
+112.213 mln
0.0%
jan 1, 1995
3.792 bln
+3.679 bln
3.28K%
jan 1, 1996
4.506 bln
+714.528 mln
18.85%
jan 1, 1997
4.766 bln
+259.595 mln
5.76%
jan 1, 1998
4.275 bln
-490.342 mln
-10.29%
jan 1, 1999
3.284 bln
-991.017 mln
-23.18%
jan 1, 2000
2.1 bln
-1.185 bln
-36.07%
jan 1, 2001
579.64 mln
-1.52 bln
-72.39%
jan 1, 2002
1.447 bln
+867.213 mln
149.61%
jan 1, 2003
2.064 bln
+617.646 mln
42.69%
jan 1, 2004
3.314 bln
+1.249 bln
60.5%
jan 1, 2005
6.324 bln
+3.01 bln
90.84%
jan 1, 2006
10.067 bln
+3.743 bln
59.2%
jan 1, 2007
16.825 bln
+6.758 bln
67.13%
jan 1, 2008
26.205 bln
+9.38 bln
55.75%
jan 1, 2009
36.193 bln
+9.989 bln
38.12%
jan 1, 2010
26.747 bln
-9.447 bln
-26.1%
jan 1, 2011
27.753 bln
+1.006 bln
3.76%
jan 1, 2012
33.556 bln
+5.803 bln
20.91%
jan 1, 2013
40.838 bln
+7.282 bln
21.7%
jan 1, 2014
48.036 bln
+7.198 bln
17.63%
jan 1, 2015
43.804 bln
-4.232 bln
-8.81%
jan 1, 2016
28.19 bln
-15.614 bln
-35.64%
Ranking of countries by current statistics by years


Comments: