29
/
en
AIzaSyAYiBZKx7MnpbEhh9jyipgxe19OcubqV5w
April 1, 2024
30197
Euro area
EMU
false
2
1
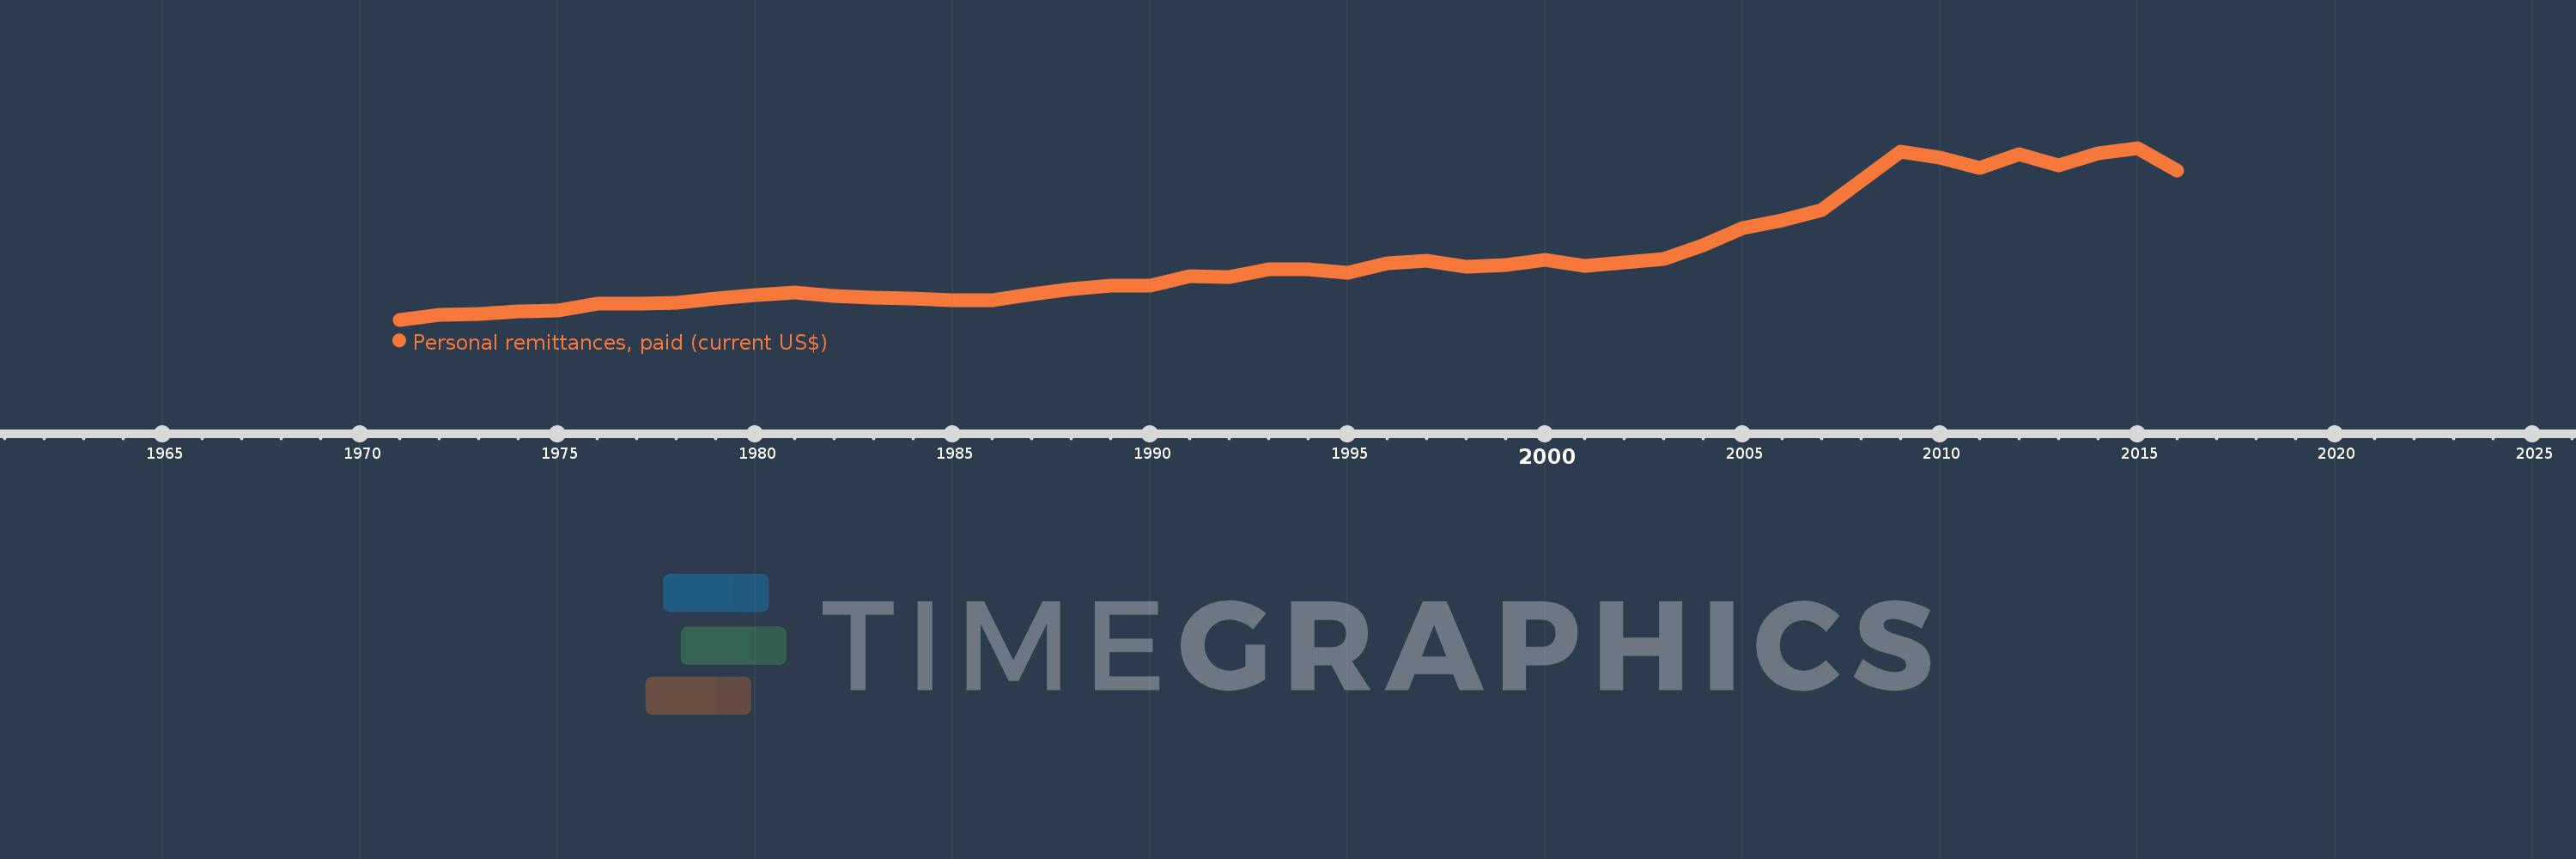
Personal remittances, paid (current US$)
2016,2015,2014,2013,2012,2011,2010,2009,2008,2007,2006,2005,2004,2003,2002,2001,2000,1999,1998,1997,1996,1995,1994,1993,1992,1991,1990,1989,1988,1987,1986,1985,1984,1983,1982,1981,1980,1979,1978,1977,1976,1975,1974,1973,1972,1971
This statistics in other country:
AfghanistanAlbaniaAlgeriaAngolaAntigua and BarbudaArab WorldArgentinaArmeniaArubaAustraliaAustriaAzerbaijanBahamas, TheBahrainBangladeshBarbadosBelarusBelgiumBelizeBeninBermudaBhutanBoliviaBosnia and HerzegovinaBotswanaBrazilBrunei DarussalamBulgariaBurkina FasoBurundiCabo VerdeCambodiaCameroonCanadaCaribbean small statesCentral African RepublicCentral Europe and the BalticsChadChileChinaColombiaComorosCongo, Dem. Rep.Congo, Rep.Costa RicaCote d'IvoireCroatiaCuracaoCyprusCzech RepublicDenmarkDjiboutiDominicaDominican RepublicEarly-demographic dividendEast Asia & PacificEast Asia & Pacific (excluding high income)East Asia & Pacific (IDA & IBRD countries)EcuadorEgypt, Arab Rep.El SalvadorEquatorial GuineaEritreaEstoniaEthiopiaEuro areaEurope & Central AsiaEurope & Central Asia (excluding high income)Europe & Central Asia (IDA & IBRD countries)European UnionFaroe IslandsFijiFinlandFragile and conflict affected situationsFranceFrench PolynesiaGabonGambia, TheGeorgiaGermanyGhanaGreeceGrenadaGuatemalaGuineaGuinea-BissauGuyanaHaitiHeavily indebted poor countries (HIPC)High incomeHondurasHong Kong SAR, ChinaHungaryIBRD onlyIcelandIDA & IBRD totalIDA blendIDA onlyIDA totalIndiaIndonesiaIraqIrelandIsraelItalyJamaicaJapanJordanKazakhstanKenyaKiribatiKorea, Rep.KosovoKuwaitKyrgyz RepublicLao PDRLate-demographic dividendLatin America & Caribbean Latin America & Caribbean (excluding high income)Latin America & the Caribbean (IDA & IBRD countries)LatviaLeast developed countries: UN classificationLebanonLesothoLiberiaLibyaLithuaniaLow & middle incomeLow incomeLower middle incomeLuxembourgMacao SAR, ChinaMacedonia, FYRMadagascarMalawiMalaysiaMaldivesMaliMaltaMarshall IslandsMauritaniaMauritiusMexicoMicronesia, Fed. Sts.Middle East & North AfricaMiddle East & North Africa (excluding high income)Middle East & North Africa (IDA & IBRD countries)Middle incomeMoldovaMongoliaMontenegroMoroccoMozambiqueMyanmarNamibiaNepalNetherlandsNew CaledoniaNew ZealandNicaraguaNigerNigeriaNorth AmericaNorwayOECD membersOmanOther small statesPacific island small statesPakistanPalauPanamaPapua New GuineaParaguayPeruPhilippinesPolandPortugalPost-demographic dividendPre-demographic dividendQatarRomaniaRussian FederationRwandaSamoaSao Tome and PrincipeSaudi ArabiaSenegalSerbiaSeychellesSierra LeoneSint Maarten (Dutch part)Slovak RepublicSloveniaSmall statesSolomon IslandsSomaliaSouth AfricaSouth AsiaSouth Asia (IDA & IBRD)South SudanSpainSri LankaSt. Kitts and NevisSt. LuciaSt. Vincent and the GrenadinesSub-Saharan Africa Sub-Saharan Africa (excluding high income)Sub-Saharan Africa (IDA & IBRD countries)SudanSurinameSwazilandSwedenSwitzerlandSyrian Arab RepublicTajikistanTanzaniaThailandTimor-LesteTogoTongaTrinidad and TobagoTunisiaTurkeyTurkmenistanTuvaluUgandaUkraineUnited KingdomUnited StatesUpper middle incomeUruguayVanuatuVenezuela, RBVietnamWest Bank and GazaWorldYemen, Rep.ZambiaZimbabwe Timeline:
This timeline shows a graph from 1971 to 2016 of Euro area. No data until 1970. Number of actual observations by date: 46.
Source name:
World Development Indicators
Source organization:
World Bank staff estimates based on IMF balance of payments data.
Categories, topics:
Economy & Growth, Financial Sector
Last updated:
apr 23, 2017
Indicators value changes by year
Minimum:
311.508 mln
jan 1, 1971
Maximum:
86.505 bln
jan 1, 2015
At the date of observation
Value
Absolute change
Change from previous value
jan 1, 1971
311.508 mln
+311.508 mln
0.0%
jan 1, 1972
2.639 bln
+2.327 bln
747.09%
jan 1, 1973
3.261 bln
+622.621 mln
23.6%
jan 1, 1974
4.454 bln
+1.193 bln
36.57%
jan 1, 1975
4.958 bln
+503.619 mln
11.31%
jan 1, 1976
8.188 bln
+3.23 bln
65.15%
jan 1, 1977
8.399 bln
+211.436 mln
2.58%
jan 1, 1978
8.865 bln
+465.916 mln
5.55%
jan 1, 1979
11.098 bln
+2.233 bln
25.19%
jan 1, 1980
12.684 bln
+1.586 bln
14.29%
jan 1, 1981
14.035 bln
+1.351 bln
10.65%
jan 1, 1982
12.383 bln
-1.652 bln
-11.77%
jan 1, 1983
11.59 bln
-793.252 mln
-6.41%
jan 1, 1984
10.879 bln
-710.455 mln
-6.13%
jan 1, 1985
10.212 bln
-667.788 mln
-6.14%
jan 1, 1986
10.279 bln
+67.196 mln
0.66%
jan 1, 1987
13.008 bln
+2.729 bln
26.55%
jan 1, 1988
15.778 bln
+2.769 bln
21.29%
jan 1, 1989
17.447 bln
+1.669 bln
10.58%
jan 1, 1990
17.316 bln
-131.272 mln
-0.75%
jan 1, 1991
22.262 bln
+4.946 bln
28.57%
jan 1, 1992
21.818 bln
-443.779 mln
-1.99%
jan 1, 1993
25.726 bln
+3.907 bln
17.91%
jan 1, 1994
25.702 bln
-23.129 mln
-0.09%
jan 1, 1995
23.847 bln
-1.855 bln
-7.22%
jan 1, 1996
28.743 bln
+4.896 bln
20.53%
jan 1, 1997
29.981 bln
+1.238 bln
4.31%
jan 1, 1998
27.06 bln
-2.92 bln
-9.74%
jan 1, 1999
27.663 bln
+602.57 mln
2.23%
jan 1, 2000
30.45 bln
+2.787 bln
10.07%
jan 1, 2001
27.252 bln
-3.198 bln
-10.5%
jan 1, 2002
29.169 bln
+1.918 bln
7.04%
jan 1, 2003
30.893 bln
+1.724 bln
5.91%
jan 1, 2004
37.821 bln
+6.928 bln
22.43%
jan 1, 2005
46.105 bln
+8.284 bln
21.9%
jan 1, 2006
50.201 bln
+4.095 bln
8.88%
jan 1, 2007
55.529 bln
+5.329 bln
10.61%
jan 1, 2008
69.835 bln
+14.305 bln
25.76%
jan 1, 2009
84.497 bln
+14.663 bln
21.0%
jan 1, 2010
81.78 bln
-2.718 bln
-3.22%
jan 1, 2011
76.624 bln
-5.156 bln
-6.3%
jan 1, 2012
83.26 bln
+6.636 bln
8.66%
jan 1, 2013
77.675 bln
-5.585 bln
-6.71%
jan 1, 2014
83.987 bln
+6.312 bln
8.13%
jan 1, 2015
86.505 bln
+2.518 bln
3.0%
jan 1, 2016
75.207 bln
-11.297 bln
-13.06%
Ranking of countries by current statistics by years


Comments: