29
/
en
AIzaSyAYiBZKx7MnpbEhh9jyipgxe19OcubqV5w
April 1, 2024
214684
Norway
NOR
true
2
1
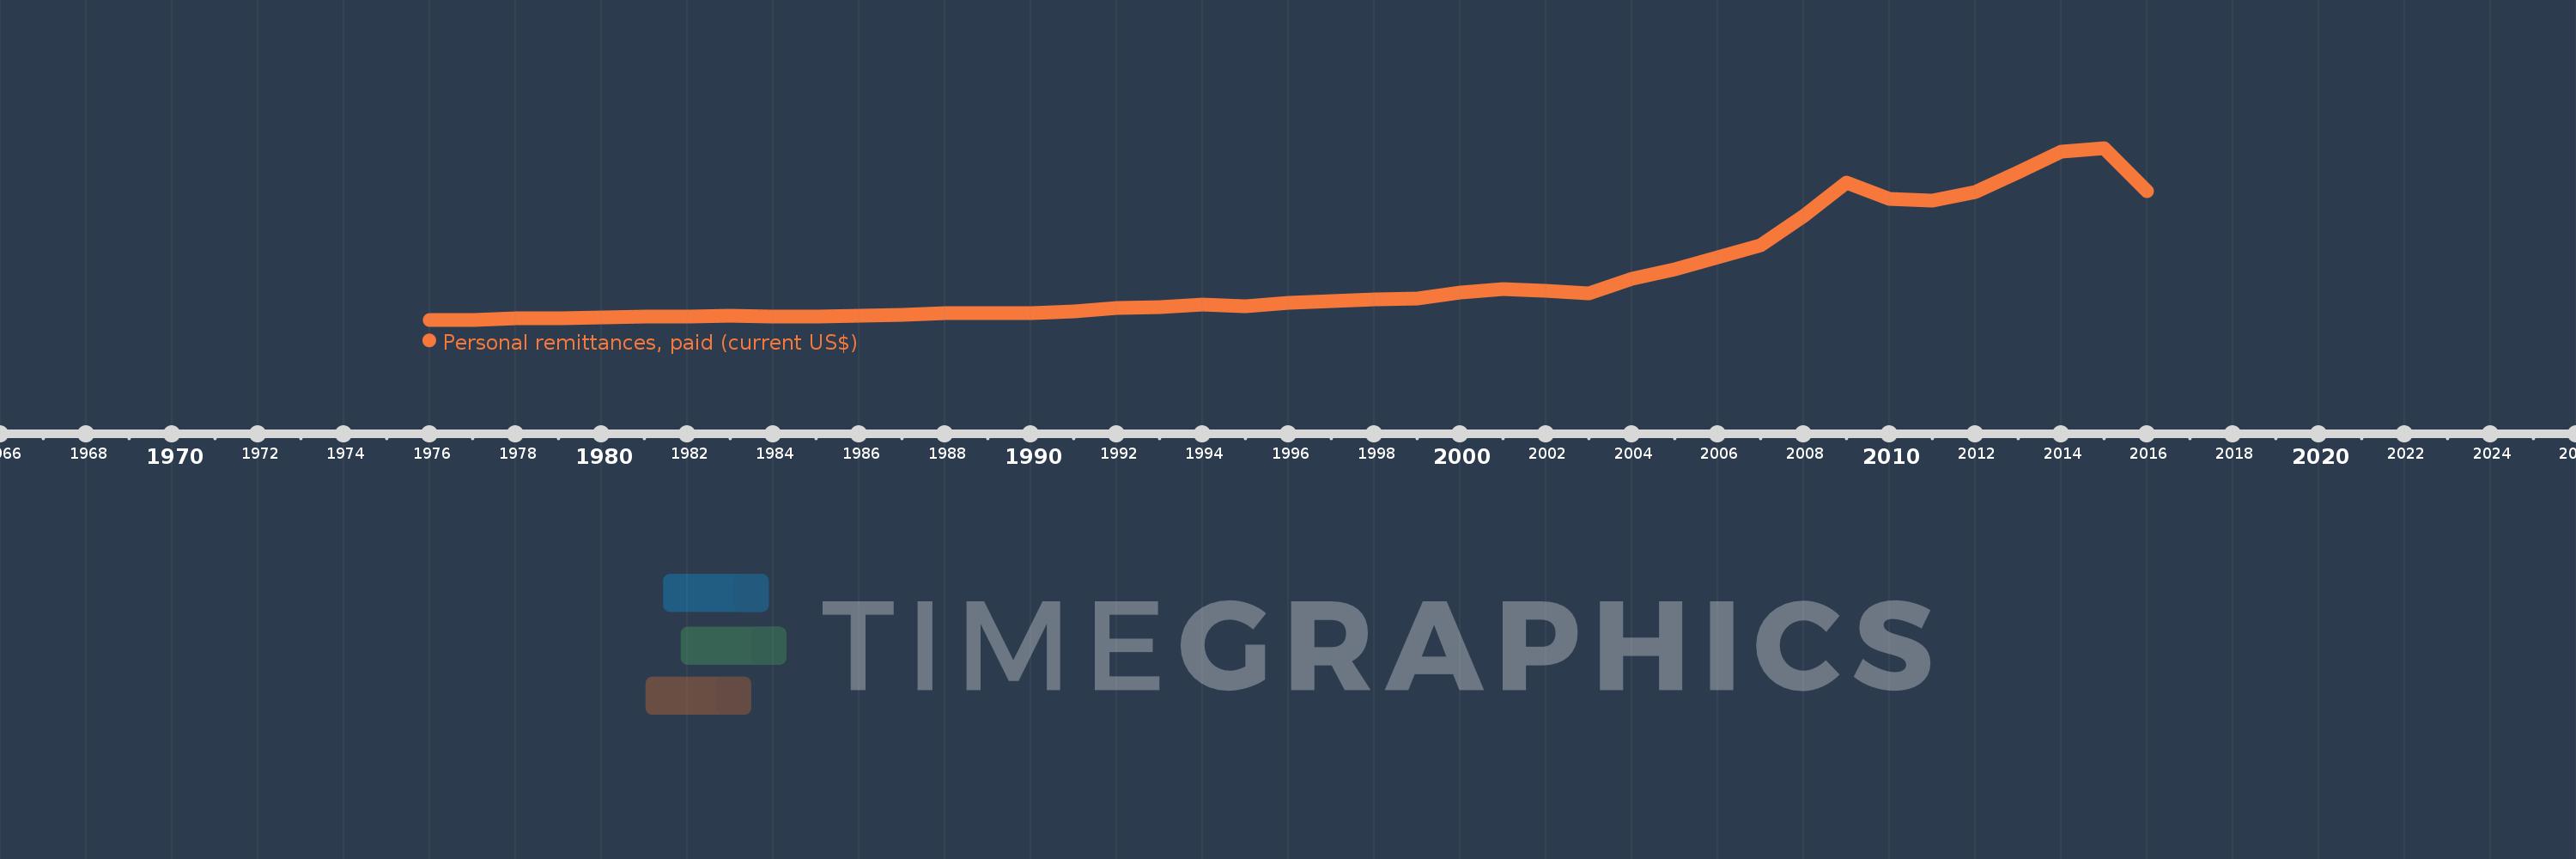
Personal remittances, paid (current US$)
2016,2015,2014,2013,2012,2011,2010,2009,2008,2007,2006,2005,2004,2003,2002,2001,2000,1999,1998,1997,1996,1995,1994,1993,1992,1991,1990,1989,1988,1987,1986,1985,1984,1983,1982,1981,1980,1979,1978,1977,1976
This statistics in other country:
AfghanistanAlbaniaAlgeriaAngolaAntigua and BarbudaArab WorldArgentinaArmeniaArubaAustraliaAustriaAzerbaijanBahamas, TheBahrainBangladeshBarbadosBelarusBelgiumBelizeBeninBermudaBhutanBoliviaBosnia and HerzegovinaBotswanaBrazilBrunei DarussalamBulgariaBurkina FasoBurundiCabo VerdeCambodiaCameroonCanadaCaribbean small statesCentral African RepublicCentral Europe and the BalticsChadChileChinaColombiaComorosCongo, Dem. Rep.Congo, Rep.Costa RicaCote d'IvoireCroatiaCuracaoCyprusCzech RepublicDenmarkDjiboutiDominicaDominican RepublicEarly-demographic dividendEast Asia & PacificEast Asia & Pacific (excluding high income)East Asia & Pacific (IDA & IBRD countries)EcuadorEgypt, Arab Rep.El SalvadorEquatorial GuineaEritreaEstoniaEthiopiaEuro areaEurope & Central AsiaEurope & Central Asia (excluding high income)Europe & Central Asia (IDA & IBRD countries)European UnionFaroe IslandsFijiFinlandFragile and conflict affected situationsFranceFrench PolynesiaGabonGambia, TheGeorgiaGermanyGhanaGreeceGrenadaGuatemalaGuineaGuinea-BissauGuyanaHaitiHeavily indebted poor countries (HIPC)High incomeHondurasHong Kong SAR, ChinaHungaryIBRD onlyIcelandIDA & IBRD totalIDA blendIDA onlyIDA totalIndiaIndonesiaIraqIrelandIsraelItalyJamaicaJapanJordanKazakhstanKenyaKiribatiKorea, Rep.KosovoKuwaitKyrgyz RepublicLao PDRLate-demographic dividendLatin America & Caribbean Latin America & Caribbean (excluding high income)Latin America & the Caribbean (IDA & IBRD countries)LatviaLeast developed countries: UN classificationLebanonLesothoLiberiaLibyaLithuaniaLow & middle incomeLow incomeLower middle incomeLuxembourgMacao SAR, ChinaMacedonia, FYRMadagascarMalawiMalaysiaMaldivesMaliMaltaMarshall IslandsMauritaniaMauritiusMexicoMicronesia, Fed. Sts.Middle East & North AfricaMiddle East & North Africa (excluding high income)Middle East & North Africa (IDA & IBRD countries)Middle incomeMoldovaMongoliaMontenegroMoroccoMozambiqueMyanmarNamibiaNepalNetherlandsNew CaledoniaNew ZealandNicaraguaNigerNigeriaNorth AmericaNorwayOECD membersOmanOther small statesPacific island small statesPakistanPalauPanamaPapua New GuineaParaguayPeruPhilippinesPolandPortugalPost-demographic dividendPre-demographic dividendQatarRomaniaRussian FederationRwandaSamoaSao Tome and PrincipeSaudi ArabiaSenegalSerbiaSeychellesSierra LeoneSint Maarten (Dutch part)Slovak RepublicSloveniaSmall statesSolomon IslandsSomaliaSouth AfricaSouth AsiaSouth Asia (IDA & IBRD)South SudanSpainSri LankaSt. Kitts and NevisSt. LuciaSt. Vincent and the GrenadinesSub-Saharan Africa Sub-Saharan Africa (excluding high income)Sub-Saharan Africa (IDA & IBRD countries)SudanSurinameSwazilandSwedenSwitzerlandSyrian Arab RepublicTajikistanTanzaniaThailandTimor-LesteTogoTongaTrinidad and TobagoTunisiaTurkeyTurkmenistanTuvaluUgandaUkraineUnited KingdomUnited StatesUpper middle incomeUruguayVanuatuVenezuela, RBVietnamWest Bank and GazaWorldYemen, Rep.ZambiaZimbabwe Timeline:
This timeline shows a graph from 1976 to 2016 of Norway. No data until 1975. Number of actual observations by date: 41.
Source name:
World Development Indicators
Source organization:
World Bank staff estimates based on IMF balance of payments data.
Categories, topics:
Economy & Growth, Financial Sector
Last updated:
apr 23, 2017
Indicators value changes by year
Minimum:
12.653 mln
jan 1, 1976
Maximum:
5.941 bln
jan 1, 2015
At the date of observation
Value
Absolute change
Change from previous value
jan 1, 1976
12.653 mln
+12.653 mln
0.0%
jan 1, 1977
14.296 mln
+1.643 mln
12.99%
jan 1, 1978
66.101 mln
+51.804 mln
362.36%
jan 1, 1979
73.0 mln
+6.899 mln
10.44%
jan 1, 1980
92.032 mln
+19.032 mln
26.07%
jan 1, 1981
109.972 mln
+17.94 mln
19.49%
jan 1, 1982
133.439 mln
+23.467 mln
21.34%
jan 1, 1983
139.73 mln
+6.291 mln
4.71%
jan 1, 1984
126.914 mln
-12.816 mln
-9.17%
jan 1, 1985
108.805 mln
-18.109 mln
-14.27%
jan 1, 1986
143.537 mln
+34.732 mln
31.92%
jan 1, 1987
181.133 mln
+37.596 mln
26.19%
jan 1, 1988
238.486 mln
+57.353 mln
31.66%
jan 1, 1989
226.984 mln
-11.501 mln
-4.82%
jan 1, 1990
250.673 mln
+23.689 mln
10.44%
jan 1, 1991
294.678 mln
+44.005 mln
17.55%
jan 1, 1992
410.612 mln
+115.934 mln
39.34%
jan 1, 1993
446.375 mln
+35.764 mln
8.71%
jan 1, 1994
531.989 mln
+85.614 mln
19.18%
jan 1, 1995
474.739 mln
-57.251 mln
-10.76%
jan 1, 1996
603.074 mln
+128.335 mln
27.03%
jan 1, 1997
647.207 mln
+44.133 mln
7.32%
jan 1, 1998
703.253 mln
+56.046 mln
8.66%
jan 1, 1999
745.71 mln
+42.457 mln
6.04%
jan 1, 2000
957.724 mln
+212.014 mln
28.43%
jan 1, 2001
1.06 bln
+101.786 mln
10.63%
jan 1, 2002
1.022 bln
-37.07 mln
-3.5%
jan 1, 2003
922.87 mln
-99.57 mln
-9.74%
jan 1, 2004
1.43 bln
+507.207 mln
54.96%
jan 1, 2005
1.749 bln
+319.139 mln
22.32%
jan 1, 2006
2.174 bln
+424.792 mln
24.28%
jan 1, 2007
2.597 bln
+422.874 mln
19.45%
jan 1, 2008
3.577 bln
+980.185 mln
37.74%
jan 1, 2009
4.75 bln
+1.173 bln
32.79%
jan 1, 2010
4.174 bln
-575.919 mln
-12.12%
jan 1, 2011
4.118 bln
-55.598 mln
-1.33%
jan 1, 2012
4.427 bln
+308.539 mln
7.49%
jan 1, 2013
5.1 bln
+672.56 mln
15.19%
jan 1, 2014
5.799 bln
+699.592 mln
13.72%
jan 1, 2015
5.941 bln
+141.968 mln
2.45%
jan 1, 2016
4.463 bln
-1.478 bln
-24.88%
Ranking of countries by current statistics by years


Comments: