29
/
en
AIzaSyAYiBZKx7MnpbEhh9jyipgxe19OcubqV5w
April 1, 2024
35286
Heavily indebted poor countries (HIPC)
HPC
false
2
1
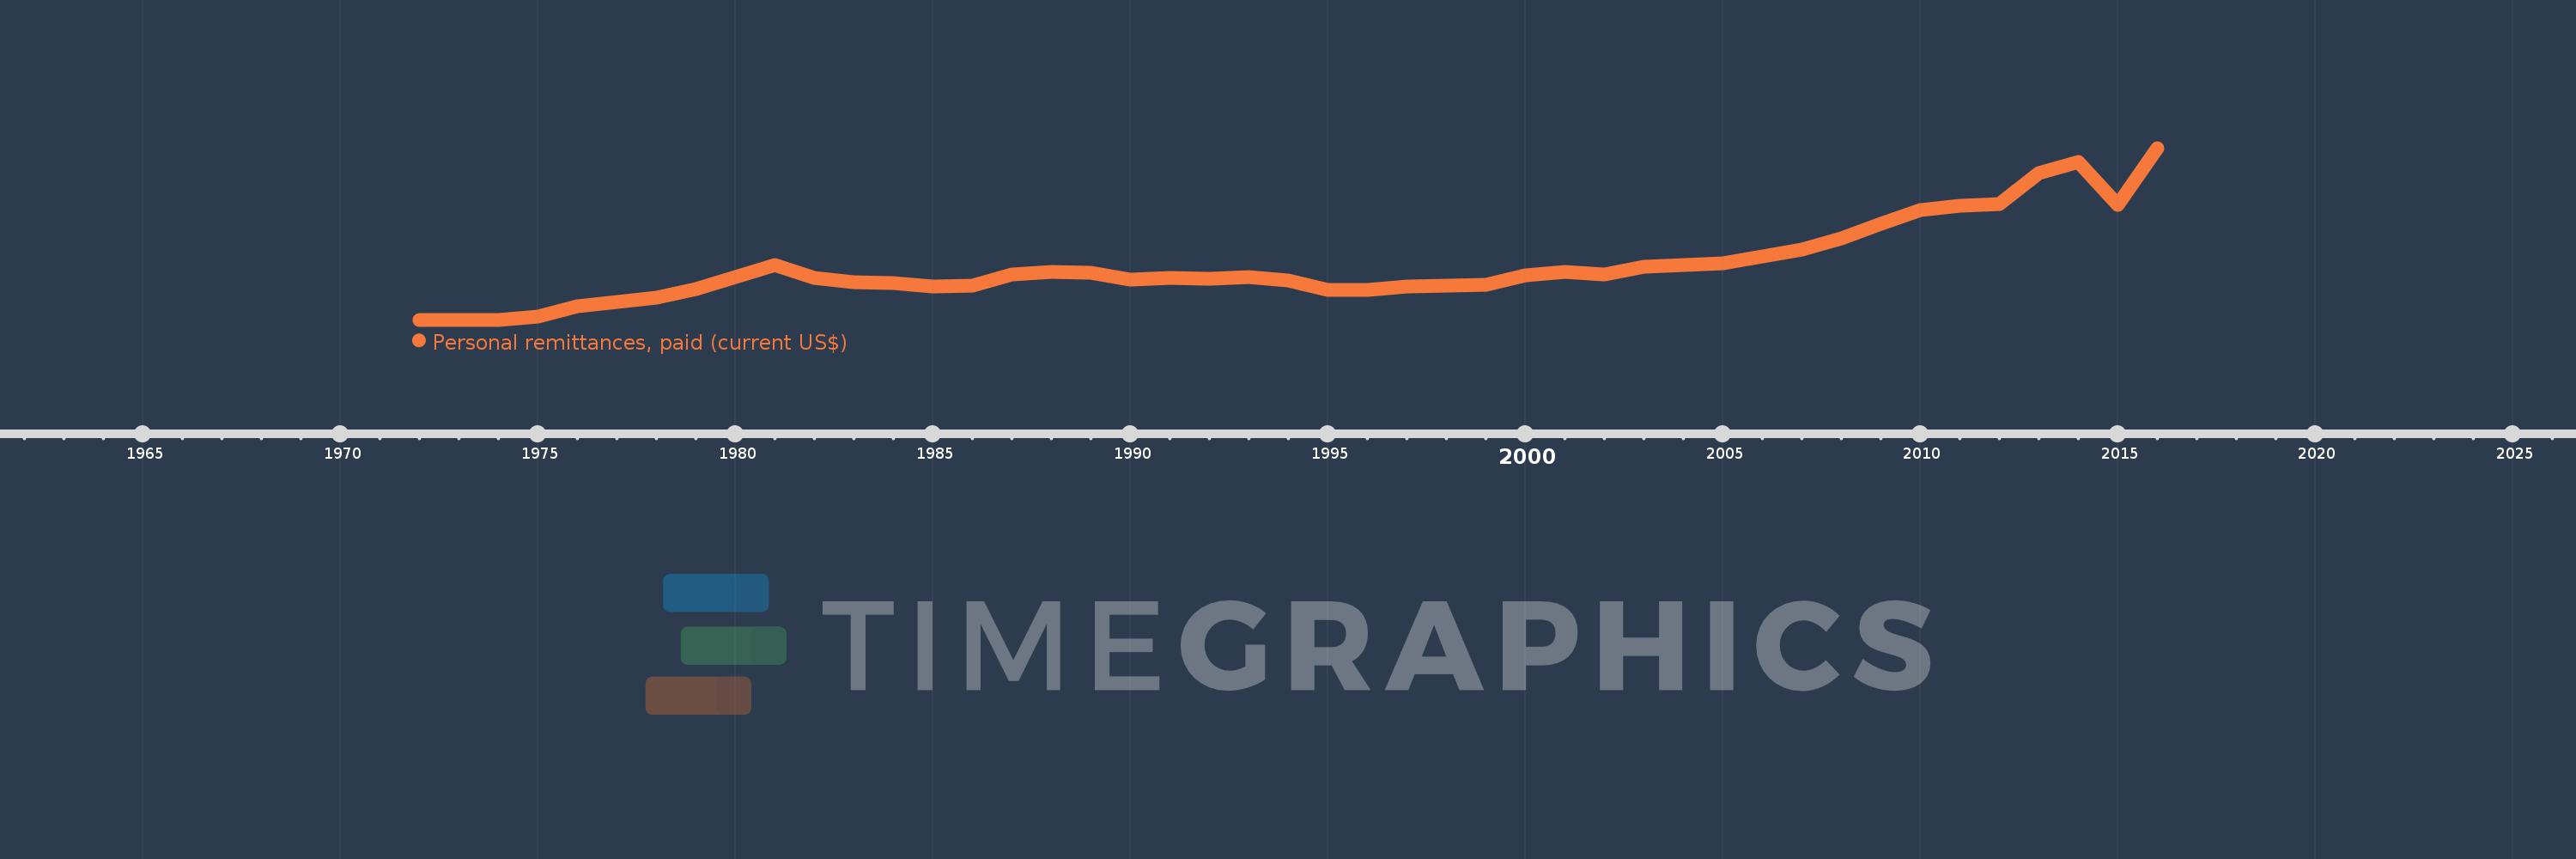
Personal remittances, paid (current US$)
2016,2015,2014,2013,2012,2011,2010,2009,2008,2007,2006,2005,2004,2003,2002,2001,2000,1999,1998,1997,1996,1995,1994,1993,1992,1991,1990,1989,1988,1987,1986,1985,1984,1983,1982,1981,1980,1979,1978,1977,1976,1975,1974,1973,1972
This statistics in other country:
AfghanistanAlbaniaAlgeriaAngolaAntigua and BarbudaArab WorldArgentinaArmeniaArubaAustraliaAustriaAzerbaijanBahamas, TheBahrainBangladeshBarbadosBelarusBelgiumBelizeBeninBermudaBhutanBoliviaBosnia and HerzegovinaBotswanaBrazilBrunei DarussalamBulgariaBurkina FasoBurundiCabo VerdeCambodiaCameroonCanadaCaribbean small statesCentral African RepublicCentral Europe and the BalticsChadChileChinaColombiaComorosCongo, Dem. Rep.Congo, Rep.Costa RicaCote d'IvoireCroatiaCuracaoCyprusCzech RepublicDenmarkDjiboutiDominicaDominican RepublicEarly-demographic dividendEast Asia & PacificEast Asia & Pacific (excluding high income)East Asia & Pacific (IDA & IBRD countries)EcuadorEgypt, Arab Rep.El SalvadorEquatorial GuineaEritreaEstoniaEthiopiaEuro areaEurope & Central AsiaEurope & Central Asia (excluding high income)Europe & Central Asia (IDA & IBRD countries)European UnionFaroe IslandsFijiFinlandFragile and conflict affected situationsFranceFrench PolynesiaGabonGambia, TheGeorgiaGermanyGhanaGreeceGrenadaGuatemalaGuineaGuinea-BissauGuyanaHaitiHeavily indebted poor countries (HIPC)High incomeHondurasHong Kong SAR, ChinaHungaryIBRD onlyIcelandIDA & IBRD totalIDA blendIDA onlyIDA totalIndiaIndonesiaIraqIrelandIsraelItalyJamaicaJapanJordanKazakhstanKenyaKiribatiKorea, Rep.KosovoKuwaitKyrgyz RepublicLao PDRLate-demographic dividendLatin America & Caribbean Latin America & Caribbean (excluding high income)Latin America & the Caribbean (IDA & IBRD countries)LatviaLeast developed countries: UN classificationLebanonLesothoLiberiaLibyaLithuaniaLow & middle incomeLow incomeLower middle incomeLuxembourgMacao SAR, ChinaMacedonia, FYRMadagascarMalawiMalaysiaMaldivesMaliMaltaMarshall IslandsMauritaniaMauritiusMexicoMicronesia, Fed. Sts.Middle East & North AfricaMiddle East & North Africa (excluding high income)Middle East & North Africa (IDA & IBRD countries)Middle incomeMoldovaMongoliaMontenegroMoroccoMozambiqueMyanmarNamibiaNepalNetherlandsNew CaledoniaNew ZealandNicaraguaNigerNigeriaNorth AmericaNorwayOECD membersOmanOther small statesPacific island small statesPakistanPalauPanamaPapua New GuineaParaguayPeruPhilippinesPolandPortugalPost-demographic dividendPre-demographic dividendQatarRomaniaRussian FederationRwandaSamoaSao Tome and PrincipeSaudi ArabiaSenegalSerbiaSeychellesSierra LeoneSint Maarten (Dutch part)Slovak RepublicSloveniaSmall statesSolomon IslandsSomaliaSouth AfricaSouth AsiaSouth Asia (IDA & IBRD)South SudanSpainSri LankaSt. Kitts and NevisSt. LuciaSt. Vincent and the GrenadinesSub-Saharan Africa Sub-Saharan Africa (excluding high income)Sub-Saharan Africa (IDA & IBRD countries)SudanSurinameSwazilandSwedenSwitzerlandSyrian Arab RepublicTajikistanTanzaniaThailandTimor-LesteTogoTongaTrinidad and TobagoTunisiaTurkeyTurkmenistanTuvaluUgandaUkraineUnited KingdomUnited StatesUpper middle incomeUruguayVanuatuVenezuela, RBVietnamWest Bank and GazaWorldYemen, Rep.ZambiaZimbabwe Timeline:
This timeline shows a graph from 1972 to 2016 of Heavily indebted poor countries (HIPC). No data until 1971. Number of actual observations by date: 45.
Source name:
World Development Indicators
Source organization:
World Bank staff estimates based on IMF balance of payments data.
Categories, topics:
Economy & Growth, Financial Sector
Last updated:
apr 23, 2017
Indicators value changes by year
Minimum:
3.28 mln
jan 1, 1973
Maximum:
4.823 bln
jan 1, 2016
At the date of observation
Value
Absolute change
Change from previous value
jan 1, 1972
5.4 mln
+5.4 mln
0.0%
jan 1, 1973
3.28 mln
-2.12 mln
-39.26%
jan 1, 1974
7.94 mln
+4.66 mln
142.07%
jan 1, 1975
97.287 mln
+89.347 mln
1.13K%
jan 1, 1976
393.372 mln
+296.085 mln
304.34%
jan 1, 1977
509.436 mln
+116.064 mln
29.5%
jan 1, 1978
610.664 mln
+101.228 mln
19.87%
jan 1, 1979
851.764 mln
+241.1 mln
39.48%
jan 1, 1980
1.209 bln
+357.433 mln
41.96%
jan 1, 1981
1.536 bln
+326.873 mln
27.03%
jan 1, 1982
1.183 bln
-352.761 mln
-22.97%
jan 1, 1983
1.062 bln
-121.705 mln
-10.29%
jan 1, 1984
1.035 bln
-26.153 mln
-2.46%
jan 1, 1985
943.112 mln
-92.338 mln
-8.92%
jan 1, 1986
968.346 mln
+25.234 mln
2.68%
jan 1, 1987
1.275 bln
+306.483 mln
31.65%
jan 1, 1988
1.35 bln
+74.857 mln
5.87%
jan 1, 1989
1.313 bln
-36.489 mln
-2.7%
jan 1, 1990
1.125 bln
-188.021 mln
-14.32%
jan 1, 1991
1.189 bln
+63.439 mln
5.64%
jan 1, 1992
1.151 bln
-37.525 mln
-3.16%
jan 1, 1993
1.206 bln
+54.947 mln
4.77%
jan 1, 1994
1.096 bln
-110.14 mln
-9.13%
jan 1, 1995
836.717 mln
-259.181 mln
-23.65%
jan 1, 1996
833.503 mln
-3.214 mln
-0.38%
jan 1, 1997
932.229 mln
+98.726 mln
11.84%
jan 1, 1998
966.421 mln
+34.192 mln
3.67%
jan 1, 1999
974.074 mln
+7.653 mln
0.79%
jan 1, 2000
1.26 bln
+286.332 mln
29.4%
jan 1, 2001
1.347 bln
+87.004 mln
6.9%
jan 1, 2002
1.278 bln
-69.421 mln
-5.15%
jan 1, 2003
1.496 bln
+218.331 mln
17.08%
jan 1, 2004
1.541 bln
+44.76 mln
2.99%
jan 1, 2005
1.595 bln
+53.48 mln
3.47%
jan 1, 2006
1.779 bln
+184.378 mln
11.56%
jan 1, 2007
1.967 bln
+188.423 mln
10.59%
jan 1, 2008
2.278 bln
+310.579 mln
15.79%
jan 1, 2009
2.707 bln
+428.613 mln
18.82%
jan 1, 2010
3.071 bln
+364.235 mln
13.46%
jan 1, 2011
3.199 bln
+128.315 mln
4.18%
jan 1, 2012
3.249 bln
+49.878 mln
1.56%
jan 1, 2013
4.113 bln
+863.613 mln
26.58%
jan 1, 2014
4.426 bln
+313.83 mln
7.63%
jan 1, 2015
3.235 bln
-1.191 bln
-26.92%
jan 1, 2016
4.823 bln
+1.588 bln
49.08%
Ranking of countries by current statistics by years


Comments: