29
/
en
AIzaSyAYiBZKx7MnpbEhh9jyipgxe19OcubqV5w
April 1, 2024
188266
Malaysia
MYS
true
2
1
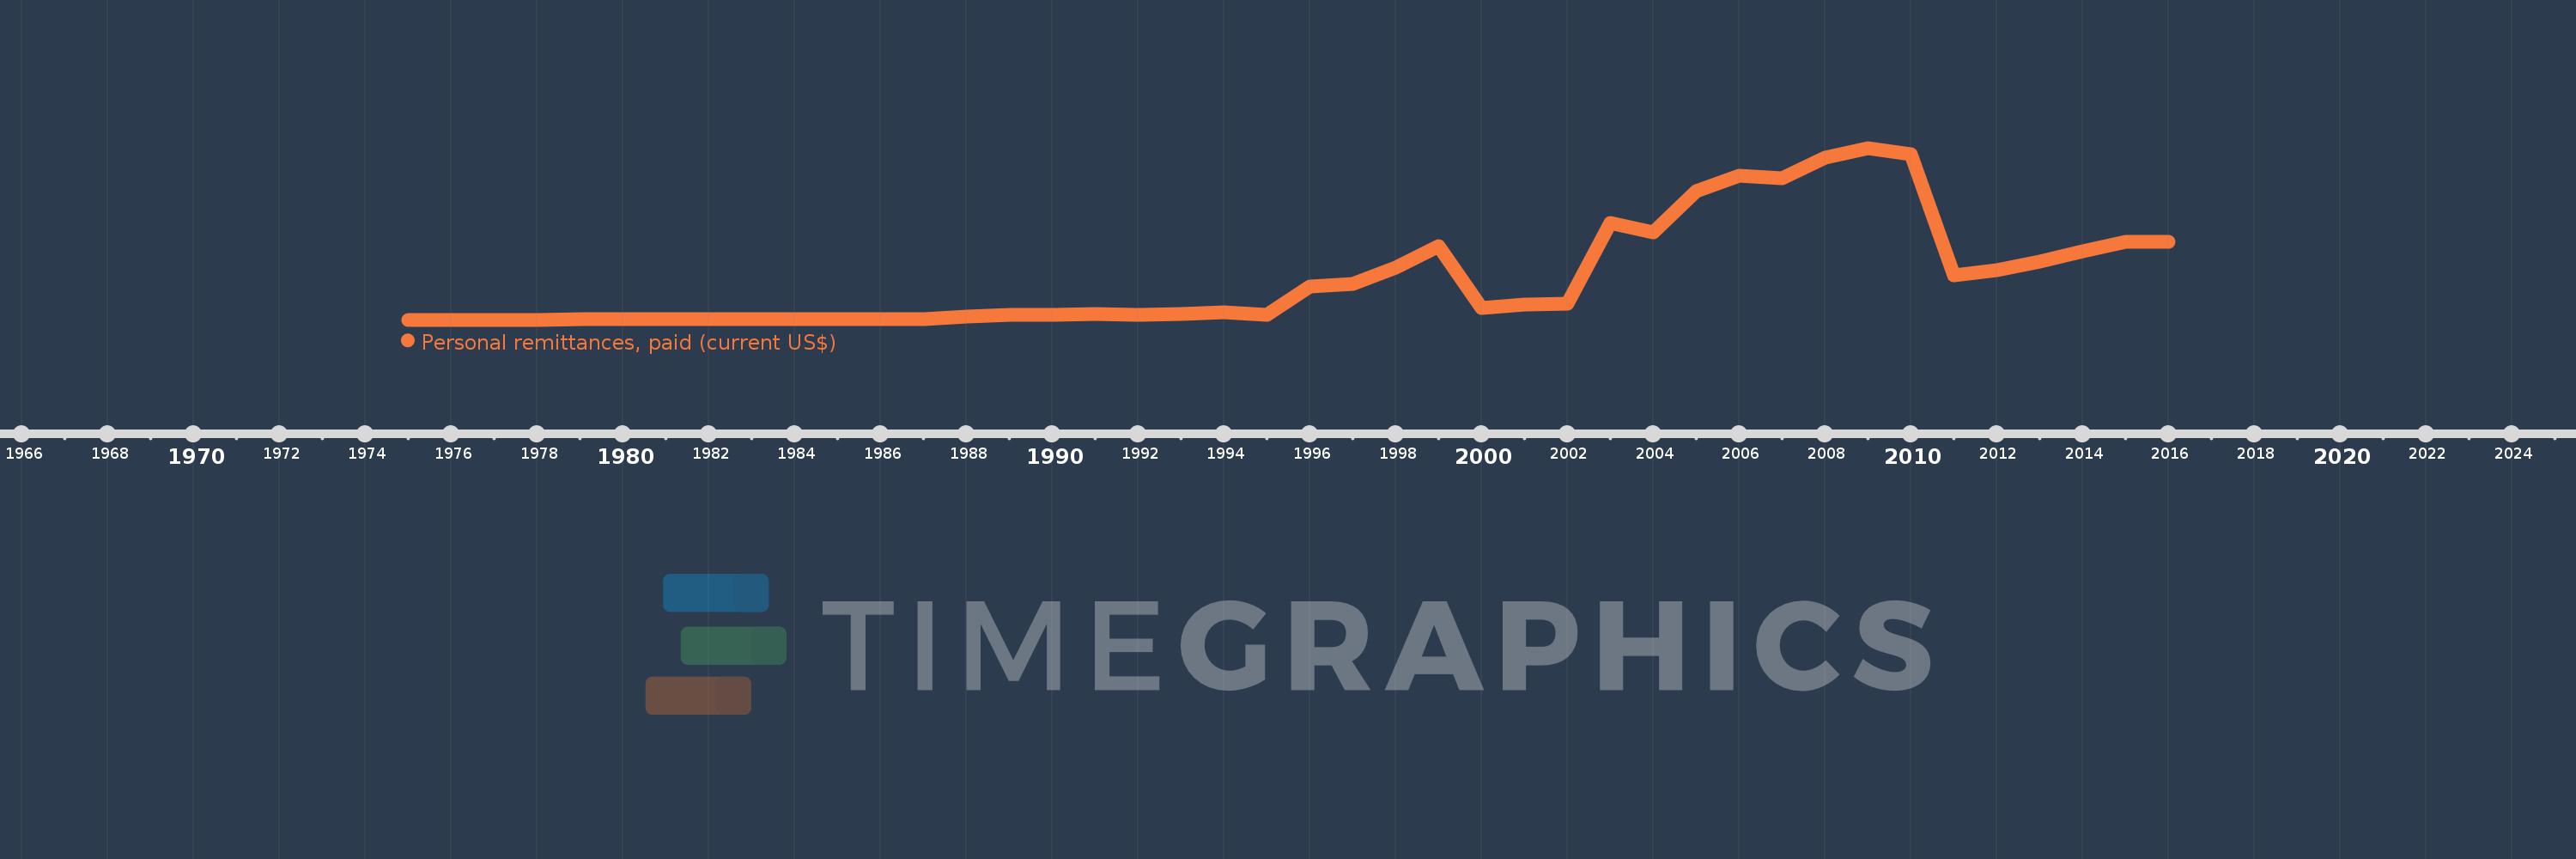
Personal remittances, paid (current US$)
2016,2015,2014,2013,2012,2011,2010,2009,2008,2007,2006,2005,2004,2003,2002,2001,2000,1999,1998,1997,1996,1995,1994,1993,1992,1991,1990,1989,1988,1987,1986,1985,1984,1983,1982,1981,1980,1979,1978,1977,1976,1975
This statistics in other country:
AfghanistanAlbaniaAlgeriaAngolaAntigua and BarbudaArab WorldArgentinaArmeniaArubaAustraliaAustriaAzerbaijanBahamas, TheBahrainBangladeshBarbadosBelarusBelgiumBelizeBeninBermudaBhutanBoliviaBosnia and HerzegovinaBotswanaBrazilBrunei DarussalamBulgariaBurkina FasoBurundiCabo VerdeCambodiaCameroonCanadaCaribbean small statesCentral African RepublicCentral Europe and the BalticsChadChileChinaColombiaComorosCongo, Dem. Rep.Congo, Rep.Costa RicaCote d'IvoireCroatiaCuracaoCyprusCzech RepublicDenmarkDjiboutiDominicaDominican RepublicEarly-demographic dividendEast Asia & PacificEast Asia & Pacific (excluding high income)East Asia & Pacific (IDA & IBRD countries)EcuadorEgypt, Arab Rep.El SalvadorEquatorial GuineaEritreaEstoniaEthiopiaEuro areaEurope & Central AsiaEurope & Central Asia (excluding high income)Europe & Central Asia (IDA & IBRD countries)European UnionFaroe IslandsFijiFinlandFragile and conflict affected situationsFranceFrench PolynesiaGabonGambia, TheGeorgiaGermanyGhanaGreeceGrenadaGuatemalaGuineaGuinea-BissauGuyanaHaitiHeavily indebted poor countries (HIPC)High incomeHondurasHong Kong SAR, ChinaHungaryIBRD onlyIcelandIDA & IBRD totalIDA blendIDA onlyIDA totalIndiaIndonesiaIraqIrelandIsraelItalyJamaicaJapanJordanKazakhstanKenyaKiribatiKorea, Rep.KosovoKuwaitKyrgyz RepublicLao PDRLate-demographic dividendLatin America & Caribbean Latin America & Caribbean (excluding high income)Latin America & the Caribbean (IDA & IBRD countries)LatviaLeast developed countries: UN classificationLebanonLesothoLiberiaLibyaLithuaniaLow & middle incomeLow incomeLower middle incomeLuxembourgMacao SAR, ChinaMacedonia, FYRMadagascarMalawiMalaysiaMaldivesMaliMaltaMarshall IslandsMauritaniaMauritiusMexicoMicronesia, Fed. Sts.Middle East & North AfricaMiddle East & North Africa (excluding high income)Middle East & North Africa (IDA & IBRD countries)Middle incomeMoldovaMongoliaMontenegroMoroccoMozambiqueMyanmarNamibiaNepalNetherlandsNew CaledoniaNew ZealandNicaraguaNigerNigeriaNorth AmericaNorwayOECD membersOmanOther small statesPacific island small statesPakistanPalauPanamaPapua New GuineaParaguayPeruPhilippinesPolandPortugalPost-demographic dividendPre-demographic dividendQatarRomaniaRussian FederationRwandaSamoaSao Tome and PrincipeSaudi ArabiaSenegalSerbiaSeychellesSierra LeoneSint Maarten (Dutch part)Slovak RepublicSloveniaSmall statesSolomon IslandsSomaliaSouth AfricaSouth AsiaSouth Asia (IDA & IBRD)South SudanSpainSri LankaSt. Kitts and NevisSt. LuciaSt. Vincent and the GrenadinesSub-Saharan Africa Sub-Saharan Africa (excluding high income)Sub-Saharan Africa (IDA & IBRD countries)SudanSurinameSwazilandSwedenSwitzerlandSyrian Arab RepublicTajikistanTanzaniaThailandTimor-LesteTogoTongaTrinidad and TobagoTunisiaTurkeyTurkmenistanTuvaluUgandaUkraineUnited KingdomUnited StatesUpper middle incomeUruguayVanuatuVenezuela, RBVietnamWest Bank and GazaWorldYemen, Rep.ZambiaZimbabwe Timeline:
This timeline shows a graph from 1975 to 2016 of Malaysia. No data until 1974. Number of actual observations by date: 42.
Source name:
World Development Indicators
Source organization:
World Bank staff estimates based on IMF balance of payments data.
Categories, topics:
Economy & Growth, Financial Sector
Last updated:
apr 23, 2017
Indicators value changes by year
Minimum:
4.57 mln
jan 1, 1975
Maximum:
6.786 bln
jan 1, 2009
At the date of observation
Value
Absolute change
Change from previous value
jan 1, 1975
4.57 mln
+4.57 mln
0.0%
jan 1, 1976
4.595 mln
+25.359K
0.55%
jan 1, 1977
5.902 mln
+1.307 mln
28.43%
jan 1, 1978
10.564 mln
+4.662 mln
78.99%
jan 1, 1979
19.43 mln
+8.866 mln
83.93%
jan 1, 1980
12.338 mln
-7.092 mln
-36.5%
jan 1, 1981
18.834 mln
+6.497 mln
52.66%
jan 1, 1982
16.926 mln
-1.908 mln
-10.13%
jan 1, 1983
15.415 mln
-1.511 mln
-8.93%
jan 1, 1984
14.647 mln
-767.693K
-4.98%
jan 1, 1985
14.507 mln
-139.943K
-0.96%
jan 1, 1986
12.887 mln
-1.62 mln
-11.17%
jan 1, 1987
21.306 mln
+8.419 mln
65.32%
jan 1, 1988
130.971 mln
+109.665 mln
514.72%
jan 1, 1989
182.146 mln
+51.174 mln
39.07%
jan 1, 1990
183.842 mln
+1.697 mln
0.93%
jan 1, 1991
229.955 mln
+46.113 mln
25.08%
jan 1, 1992
205.086 mln
-24.869 mln
-10.81%
jan 1, 1993
226.507 mln
+21.421 mln
10.44%
jan 1, 1994
299.134 mln
+72.627 mln
32.06%
jan 1, 1995
187.101 mln
-112.034 mln
-37.45%
jan 1, 1996
1.329 bln
+1.142 bln
610.45%
jan 1, 1997
1.425 bln
+95.655 mln
7.2%
jan 1, 1998
2.074 bln
+649.243 mln
45.56%
jan 1, 1999
2.924 bln
+849.876 mln
40.97%
jan 1, 2000
483.684 mln
-2.44 bln
-83.46%
jan 1, 2001
598.947 mln
+115.263 mln
23.83%
jan 1, 2002
633.947 mln
+35.0 mln
5.84%
jan 1, 2003
3.826 bln
+3.192 bln
503.57%
jan 1, 2004
3.464 bln
-362.526 mln
-9.47%
jan 1, 2005
5.064 bln
+1.601 bln
46.21%
jan 1, 2006
5.679 bln
+614.921 mln
12.14%
jan 1, 2007
5.597 bln
-82.605 mln
-1.45%
jan 1, 2008
6.388 bln
+791.875 mln
14.15%
jan 1, 2009
6.786 bln
+397.048 mln
6.22%
jan 1, 2010
6.529 bln
-256.975 mln
-3.79%
jan 1, 2011
1.753 bln
-4.775 bln
-73.14%
jan 1, 2012
1.971 bln
+217.187 mln
12.39%
jan 1, 2013
2.292 bln
+321.211 mln
16.3%
jan 1, 2014
2.695 bln
+403.004 mln
17.58%
jan 1, 2015
3.077 bln
+381.622 mln
14.16%
jan 1, 2016
3.076 bln
-299.935K
-0.01%
Ranking of countries by current statistics by years


Comments: