29
/
en
AIzaSyAYiBZKx7MnpbEhh9jyipgxe19OcubqV5w
April 1, 2024
139640
Germany
DEU
true
2
1
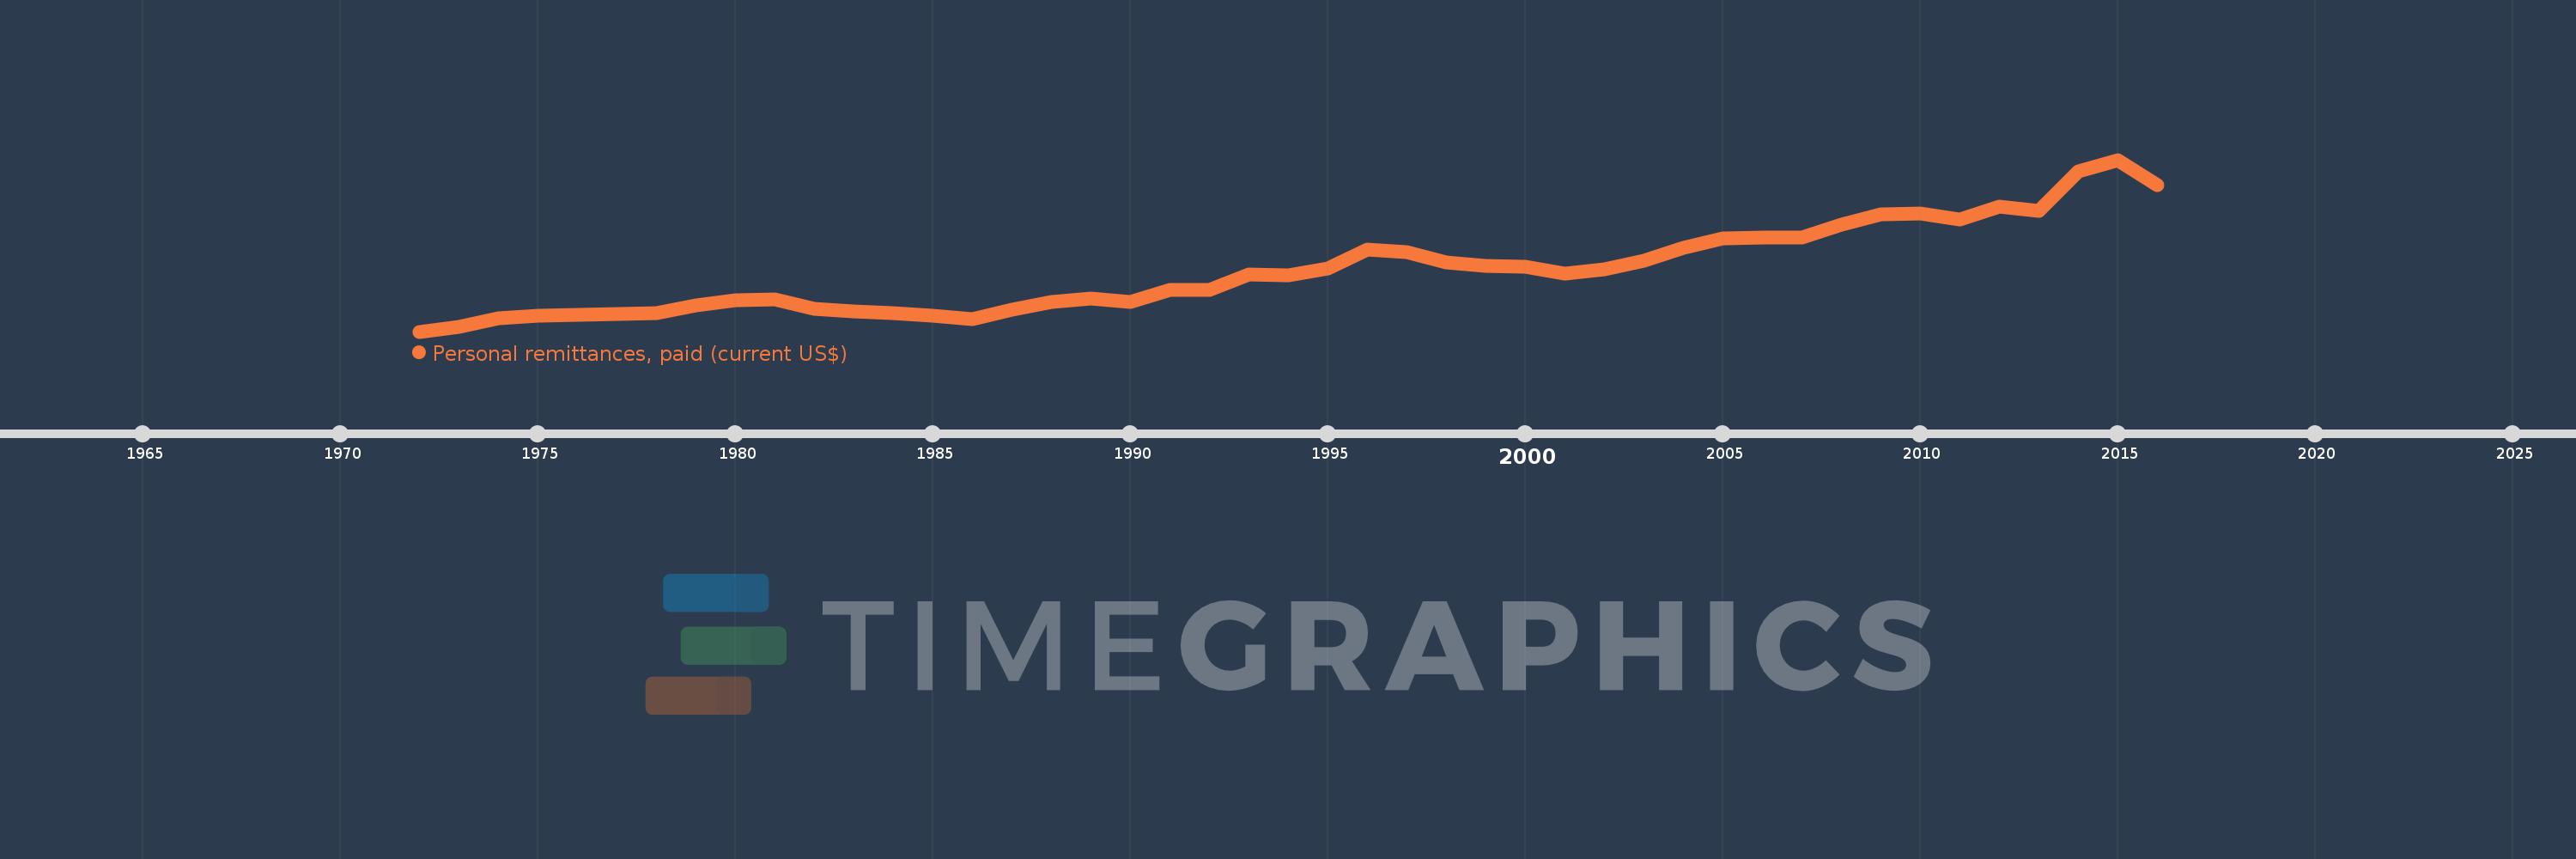
Personal remittances, paid (current US$)
2016,2015,2014,2013,2012,2011,2010,2009,2008,2007,2006,2005,2004,2003,2002,2001,2000,1999,1998,1997,1996,1995,1994,1993,1992,1991,1990,1989,1988,1987,1986,1985,1984,1983,1982,1981,1980,1979,1978,1977,1976,1975,1974,1973,1972
This statistics in other country:
AfghanistanAlbaniaAlgeriaAngolaAntigua and BarbudaArab WorldArgentinaArmeniaArubaAustraliaAustriaAzerbaijanBahamas, TheBahrainBangladeshBarbadosBelarusBelgiumBelizeBeninBermudaBhutanBoliviaBosnia and HerzegovinaBotswanaBrazilBrunei DarussalamBulgariaBurkina FasoBurundiCabo VerdeCambodiaCameroonCanadaCaribbean small statesCentral African RepublicCentral Europe and the BalticsChadChileChinaColombiaComorosCongo, Dem. Rep.Congo, Rep.Costa RicaCote d'IvoireCroatiaCuracaoCyprusCzech RepublicDenmarkDjiboutiDominicaDominican RepublicEarly-demographic dividendEast Asia & PacificEast Asia & Pacific (excluding high income)East Asia & Pacific (IDA & IBRD countries)EcuadorEgypt, Arab Rep.El SalvadorEquatorial GuineaEritreaEstoniaEthiopiaEuro areaEurope & Central AsiaEurope & Central Asia (excluding high income)Europe & Central Asia (IDA & IBRD countries)European UnionFaroe IslandsFijiFinlandFragile and conflict affected situationsFranceFrench PolynesiaGabonGambia, TheGeorgiaGermanyGhanaGreeceGrenadaGuatemalaGuineaGuinea-BissauGuyanaHaitiHeavily indebted poor countries (HIPC)High incomeHondurasHong Kong SAR, ChinaHungaryIBRD onlyIcelandIDA & IBRD totalIDA blendIDA onlyIDA totalIndiaIndonesiaIraqIrelandIsraelItalyJamaicaJapanJordanKazakhstanKenyaKiribatiKorea, Rep.KosovoKuwaitKyrgyz RepublicLao PDRLate-demographic dividendLatin America & Caribbean Latin America & Caribbean (excluding high income)Latin America & the Caribbean (IDA & IBRD countries)LatviaLeast developed countries: UN classificationLebanonLesothoLiberiaLibyaLithuaniaLow & middle incomeLow incomeLower middle incomeLuxembourgMacao SAR, ChinaMacedonia, FYRMadagascarMalawiMalaysiaMaldivesMaliMaltaMarshall IslandsMauritaniaMauritiusMexicoMicronesia, Fed. Sts.Middle East & North AfricaMiddle East & North Africa (excluding high income)Middle East & North Africa (IDA & IBRD countries)Middle incomeMoldovaMongoliaMontenegroMoroccoMozambiqueMyanmarNamibiaNepalNetherlandsNew CaledoniaNew ZealandNicaraguaNigerNigeriaNorth AmericaNorwayOECD membersOmanOther small statesPacific island small statesPakistanPalauPanamaPapua New GuineaParaguayPeruPhilippinesPolandPortugalPost-demographic dividendPre-demographic dividendQatarRomaniaRussian FederationRwandaSamoaSao Tome and PrincipeSaudi ArabiaSenegalSerbiaSeychellesSierra LeoneSint Maarten (Dutch part)Slovak RepublicSloveniaSmall statesSolomon IslandsSomaliaSouth AfricaSouth AsiaSouth Asia (IDA & IBRD)South SudanSpainSri LankaSt. Kitts and NevisSt. LuciaSt. Vincent and the GrenadinesSub-Saharan Africa Sub-Saharan Africa (excluding high income)Sub-Saharan Africa (IDA & IBRD countries)SudanSurinameSwazilandSwedenSwitzerlandSyrian Arab RepublicTajikistanTanzaniaThailandTimor-LesteTogoTongaTrinidad and TobagoTunisiaTurkeyTurkmenistanTuvaluUgandaUkraineUnited KingdomUnited StatesUpper middle incomeUruguayVanuatuVenezuela, RBVietnamWest Bank and GazaWorldYemen, Rep.ZambiaZimbabwe Timeline:
This timeline shows a graph from 1972 to 2016 of Germany. No data until 1971. Number of actual observations by date: 45.
Source name:
World Development Indicators
Source organization:
World Bank staff estimates based on IMF balance of payments data.
Categories, topics:
Economy & Growth, Financial Sector
Last updated:
apr 23, 2017
Indicators value changes by year
Minimum:
2.238 bln
jan 1, 1972
Maximum:
21.28 bln
jan 1, 2015
At the date of observation
Value
Absolute change
Change from previous value
jan 1, 1972
2.238 bln
+2.238 bln
0.0%
jan 1, 1973
2.723 bln
+485.179 mln
21.68%
jan 1, 1974
3.69 bln
+967.53 mln
35.53%
jan 1, 1975
4.017 bln
+326.532 mln
8.85%
jan 1, 1976
4.096 bln
+78.646 mln
1.96%
jan 1, 1977
4.174 bln
+78.183 mln
1.91%
jan 1, 1978
4.255 bln
+81.367 mln
1.95%
jan 1, 1979
5.183 bln
+928.254 mln
21.82%
jan 1, 1980
5.726 bln
+542.287 mln
10.46%
jan 1, 1981
5.819 bln
+93.304 mln
1.63%
jan 1, 1982
4.792 bln
-1.027 bln
-17.65%
jan 1, 1983
4.481 bln
-311.305 mln
-6.5%
jan 1, 1984
4.289 bln
-191.088 mln
-4.26%
jan 1, 1985
4.038 bln
-251.087 mln
-5.85%
jan 1, 1986
3.598 bln
-440.346 mln
-10.9%
jan 1, 1987
4.636 bln
+1.038 bln
28.86%
jan 1, 1988
5.535 bln
+898.202 mln
19.37%
jan 1, 1989
5.871 bln
+336.636 mln
6.08%
jan 1, 1990
5.483 bln
-388.662 mln
-6.62%
jan 1, 1991
6.856 bln
+1.374 bln
25.06%
jan 1, 1992
6.896 bln
+39.36 mln
0.57%
jan 1, 1993
8.589 bln
+1.694 bln
24.56%
jan 1, 1994
8.519 bln
-70.327 mln
-0.82%
jan 1, 1995
9.279 bln
+760.153 mln
8.92%
jan 1, 1996
11.348 bln
+2.068 bln
22.29%
jan 1, 1997
11.026 bln
-321.024 mln
-2.83%
jan 1, 1998
9.889 bln
-1.138 bln
-10.32%
jan 1, 1999
9.502 bln
-387.185 mln
-3.92%
jan 1, 2000
9.405 bln
-96.254 mln
-1.01%
jan 1, 2001
8.663 bln
-741.868 mln
-7.89%
jan 1, 2002
9.183 bln
+519.604 mln
6.0%
jan 1, 2003
10.115 bln
+932.013 mln
10.15%
jan 1, 2004
11.556 bln
+1.441 bln
14.25%
jan 1, 2005
12.599 bln
+1.042 bln
9.02%
jan 1, 2006
12.708 bln
+109.291 mln
0.87%
jan 1, 2007
12.697 bln
-10.533 mln
-0.08%
jan 1, 2008
14.084 bln
+1.387 bln
10.92%
jan 1, 2009
15.232 bln
+1.147 bln
8.15%
jan 1, 2010
15.323 bln
+91.414 mln
0.6%
jan 1, 2011
14.683 bln
-640.07 mln
-4.18%
jan 1, 2012
16.116 bln
+1.433 bln
9.76%
jan 1, 2013
15.588 bln
-528.727 mln
-3.28%
jan 1, 2014
19.949 bln
+4.361 bln
27.98%
jan 1, 2015
21.28 bln
+1.331 bln
6.67%
jan 1, 2016
18.456 bln
-2.824 bln
-13.27%
Ranking of countries by current statistics by years


Comments: