29
/
en
AIzaSyAYiBZKx7MnpbEhh9jyipgxe19OcubqV5w
April 1, 2024
285076
Yemen, Rep.
YEM
true
2
1
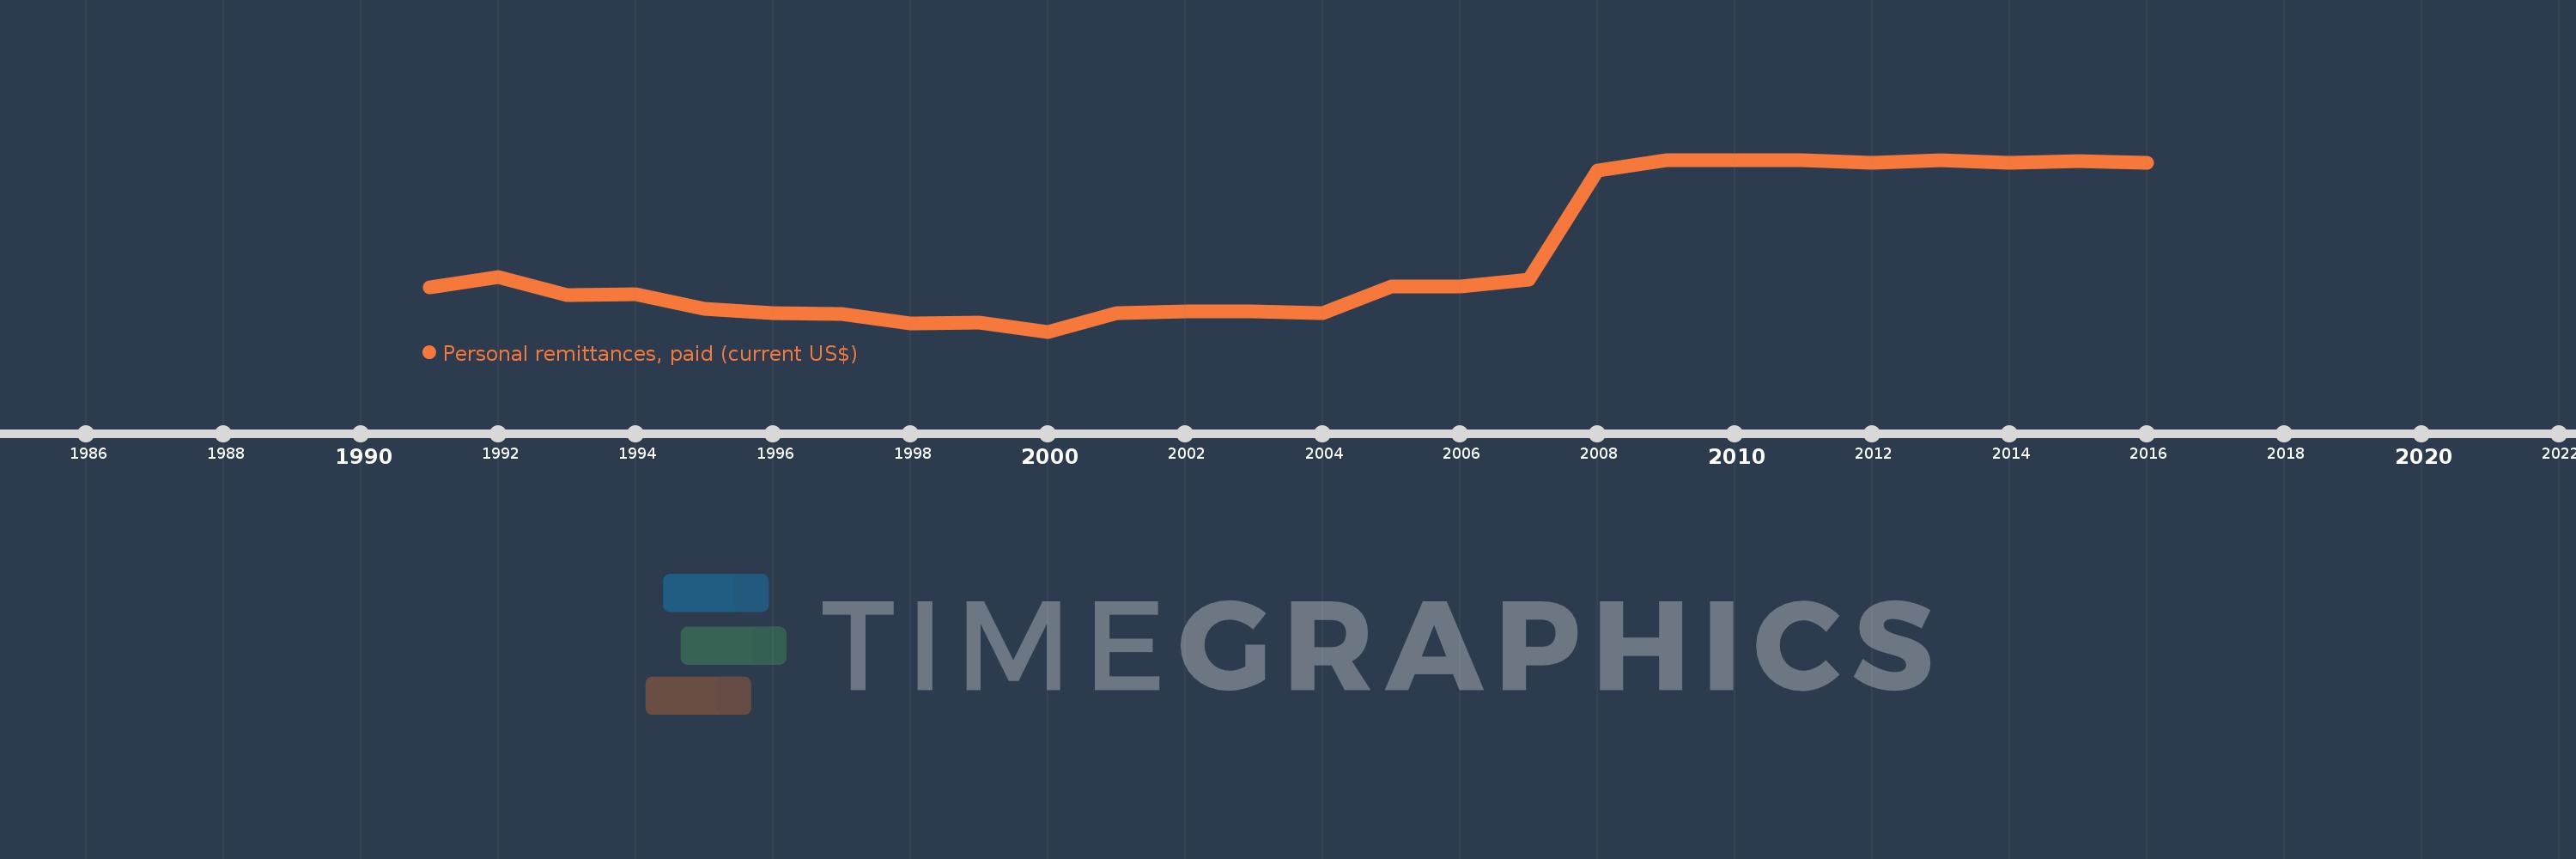
Personal remittances, paid (current US$)
2016,2015,2014,2013,2012,2011,2010,2009,2008,2007,2006,2005,2004,2003,2002,2001,2000,1999,1998,1997,1996,1995,1994,1993,1992,1991
This statistics in other country:
AfghanistanAlbaniaAlgeriaAngolaAntigua and BarbudaArab WorldArgentinaArmeniaArubaAustraliaAustriaAzerbaijanBahamas, TheBahrainBangladeshBarbadosBelarusBelgiumBelizeBeninBermudaBhutanBoliviaBosnia and HerzegovinaBotswanaBrazilBrunei DarussalamBulgariaBurkina FasoBurundiCabo VerdeCambodiaCameroonCanadaCaribbean small statesCentral African RepublicCentral Europe and the BalticsChadChileChinaColombiaComorosCongo, Dem. Rep.Congo, Rep.Costa RicaCote d'IvoireCroatiaCuracaoCyprusCzech RepublicDenmarkDjiboutiDominicaDominican RepublicEarly-demographic dividendEast Asia & PacificEast Asia & Pacific (excluding high income)East Asia & Pacific (IDA & IBRD countries)EcuadorEgypt, Arab Rep.El SalvadorEquatorial GuineaEritreaEstoniaEthiopiaEuro areaEurope & Central AsiaEurope & Central Asia (excluding high income)Europe & Central Asia (IDA & IBRD countries)European UnionFaroe IslandsFijiFinlandFragile and conflict affected situationsFranceFrench PolynesiaGabonGambia, TheGeorgiaGermanyGhanaGreeceGrenadaGuatemalaGuineaGuinea-BissauGuyanaHaitiHeavily indebted poor countries (HIPC)High incomeHondurasHong Kong SAR, ChinaHungaryIBRD onlyIcelandIDA & IBRD totalIDA blendIDA onlyIDA totalIndiaIndonesiaIraqIrelandIsraelItalyJamaicaJapanJordanKazakhstanKenyaKiribatiKorea, Rep.KosovoKuwaitKyrgyz RepublicLao PDRLate-demographic dividendLatin America & Caribbean Latin America & Caribbean (excluding high income)Latin America & the Caribbean (IDA & IBRD countries)LatviaLeast developed countries: UN classificationLebanonLesothoLiberiaLibyaLithuaniaLow & middle incomeLow incomeLower middle incomeLuxembourgMacao SAR, ChinaMacedonia, FYRMadagascarMalawiMalaysiaMaldivesMaliMaltaMarshall IslandsMauritaniaMauritiusMexicoMicronesia, Fed. Sts.Middle East & North AfricaMiddle East & North Africa (excluding high income)Middle East & North Africa (IDA & IBRD countries)Middle incomeMoldovaMongoliaMontenegroMoroccoMozambiqueMyanmarNamibiaNepalNetherlandsNew CaledoniaNew ZealandNicaraguaNigerNigeriaNorth AmericaNorwayOECD membersOmanOther small statesPacific island small statesPakistanPalauPanamaPapua New GuineaParaguayPeruPhilippinesPolandPortugalPost-demographic dividendPre-demographic dividendQatarRomaniaRussian FederationRwandaSamoaSao Tome and PrincipeSaudi ArabiaSenegalSerbiaSeychellesSierra LeoneSint Maarten (Dutch part)Slovak RepublicSloveniaSmall statesSolomon IslandsSomaliaSouth AfricaSouth AsiaSouth Asia (IDA & IBRD)South SudanSpainSri LankaSt. Kitts and NevisSt. LuciaSt. Vincent and the GrenadinesSub-Saharan Africa Sub-Saharan Africa (excluding high income)Sub-Saharan Africa (IDA & IBRD countries)SudanSurinameSwazilandSwedenSwitzerlandSyrian Arab RepublicTajikistanTanzaniaThailandTimor-LesteTogoTongaTrinidad and TobagoTunisiaTurkeyTurkmenistanTuvaluUgandaUkraineUnited KingdomUnited StatesUpper middle incomeUruguayVanuatuVenezuela, RBVietnamWest Bank and GazaWorldYemen, Rep.ZambiaZimbabwe Timeline:
This timeline shows a graph from 1991 to 2016 of Yemen, Rep.. No data until 1990. Number of actual observations by date: 26.
Source name:
World Development Indicators
Source organization:
World Bank staff estimates based on IMF balance of payments data.
Categories, topics:
Economy & Growth, Financial Sector
Last updated:
apr 23, 2017
Indicators value changes by year
Minimum:
27.0 mln
jan 1, 2000
Maximum:
338.32 mln
jan 1, 2011
At the date of observation
Value
Absolute change
Change from previous value
jan 1, 1991
106.4 mln
+106.4 mln
0.0%
jan 1, 1992
125.4 mln
+19.0 mln
17.86%
jan 1, 1993
93.8 mln
-31.6 mln
-25.2%
jan 1, 1994
94.3 mln
+500.0K
0.53%
jan 1, 1995
68.4 mln
-25.9 mln
-27.47%
jan 1, 1996
61.2 mln
-7.2 mln
-10.53%
jan 1, 1997
59.6 mln
-1.6 mln
-2.61%
jan 1, 1998
41.4 mln
-18.2 mln
-30.54%
jan 1, 1999
42.7 mln
+1.3 mln
3.14%
jan 1, 2000
27.0 mln
-15.7 mln
-36.77%
jan 1, 2001
60.504 mln
+33.504 mln
124.09%
jan 1, 2002
63.604 mln
+3.1 mln
5.12%
jan 1, 2003
64.304 mln
+700.001K
1.1%
jan 1, 2004
59.994 mln
-4.31 mln
-6.7%
jan 1, 2005
108.315 mln
+48.321 mln
80.54%
jan 1, 2006
109.496 mln
+1.18 mln
1.09%
jan 1, 2007
120.44 mln
+10.944 mln
9.99%
jan 1, 2008
318.72 mln
+198.28 mln
164.63%
jan 1, 2009
336.84 mln
+18.12 mln
5.69%
jan 1, 2010
336.84 mln
0.0
0.0%
jan 1, 2011
338.32 mln
+1.48 mln
0.44%
jan 1, 2012
333.42 mln
-4.9 mln
-1.45%
jan 1, 2013
337.707 mln
+4.287 mln
1.29%
jan 1, 2014
333.296 mln
-4.412 mln
-1.31%
jan 1, 2015
335.396 mln
+2.1 mln
0.63%
jan 1, 2016
333.39 mln
-2.006 mln
-0.6%
Ranking of countries by current statistics by years


Comments: