29
/
en
AIzaSyAYiBZKx7MnpbEhh9jyipgxe19OcubqV5w
April 1, 2024
256712
Sweden
SWE
true
2
1
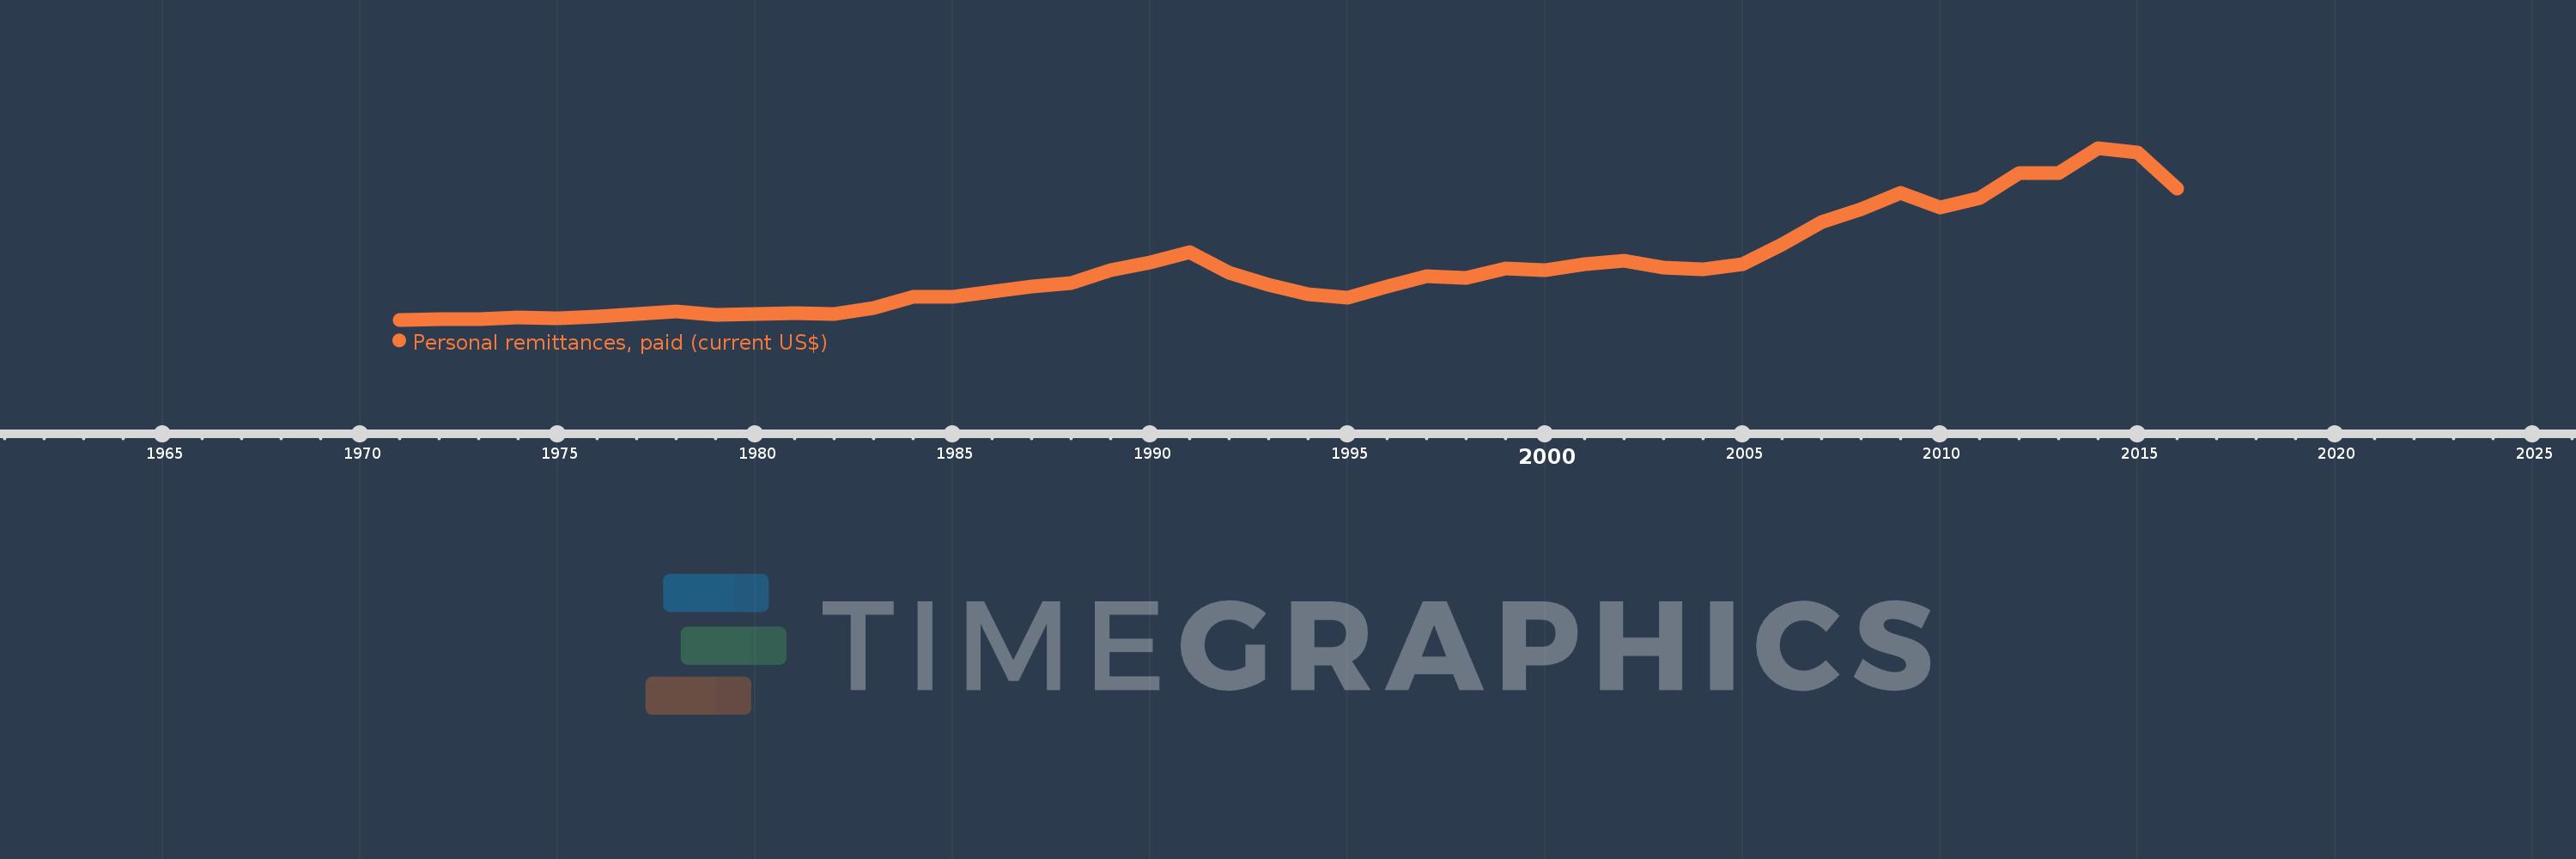
Personal remittances, paid (current US$)
2016,2015,2014,2013,2012,2011,2010,2009,2008,2007,2006,2005,2004,2003,2002,2001,2000,1999,1998,1997,1996,1995,1994,1993,1992,1991,1990,1989,1988,1987,1986,1985,1984,1983,1982,1981,1980,1979,1978,1977,1976,1975,1974,1973,1972,1971
This statistics in other country:
AfghanistanAlbaniaAlgeriaAngolaAntigua and BarbudaArab WorldArgentinaArmeniaArubaAustraliaAustriaAzerbaijanBahamas, TheBahrainBangladeshBarbadosBelarusBelgiumBelizeBeninBermudaBhutanBoliviaBosnia and HerzegovinaBotswanaBrazilBrunei DarussalamBulgariaBurkina FasoBurundiCabo VerdeCambodiaCameroonCanadaCaribbean small statesCentral African RepublicCentral Europe and the BalticsChadChileChinaColombiaComorosCongo, Dem. Rep.Congo, Rep.Costa RicaCote d'IvoireCroatiaCuracaoCyprusCzech RepublicDenmarkDjiboutiDominicaDominican RepublicEarly-demographic dividendEast Asia & PacificEast Asia & Pacific (excluding high income)East Asia & Pacific (IDA & IBRD countries)EcuadorEgypt, Arab Rep.El SalvadorEquatorial GuineaEritreaEstoniaEthiopiaEuro areaEurope & Central AsiaEurope & Central Asia (excluding high income)Europe & Central Asia (IDA & IBRD countries)European UnionFaroe IslandsFijiFinlandFragile and conflict affected situationsFranceFrench PolynesiaGabonGambia, TheGeorgiaGermanyGhanaGreeceGrenadaGuatemalaGuineaGuinea-BissauGuyanaHaitiHeavily indebted poor countries (HIPC)High incomeHondurasHong Kong SAR, ChinaHungaryIBRD onlyIcelandIDA & IBRD totalIDA blendIDA onlyIDA totalIndiaIndonesiaIraqIrelandIsraelItalyJamaicaJapanJordanKazakhstanKenyaKiribatiKorea, Rep.KosovoKuwaitKyrgyz RepublicLao PDRLate-demographic dividendLatin America & Caribbean Latin America & Caribbean (excluding high income)Latin America & the Caribbean (IDA & IBRD countries)LatviaLeast developed countries: UN classificationLebanonLesothoLiberiaLibyaLithuaniaLow & middle incomeLow incomeLower middle incomeLuxembourgMacao SAR, ChinaMacedonia, FYRMadagascarMalawiMalaysiaMaldivesMaliMaltaMarshall IslandsMauritaniaMauritiusMexicoMicronesia, Fed. Sts.Middle East & North AfricaMiddle East & North Africa (excluding high income)Middle East & North Africa (IDA & IBRD countries)Middle incomeMoldovaMongoliaMontenegroMoroccoMozambiqueMyanmarNamibiaNepalNetherlandsNew CaledoniaNew ZealandNicaraguaNigerNigeriaNorth AmericaNorwayOECD membersOmanOther small statesPacific island small statesPakistanPalauPanamaPapua New GuineaParaguayPeruPhilippinesPolandPortugalPost-demographic dividendPre-demographic dividendQatarRomaniaRussian FederationRwandaSamoaSao Tome and PrincipeSaudi ArabiaSenegalSerbiaSeychellesSierra LeoneSint Maarten (Dutch part)Slovak RepublicSloveniaSmall statesSolomon IslandsSomaliaSouth AfricaSouth AsiaSouth Asia (IDA & IBRD)South SudanSpainSri LankaSt. Kitts and NevisSt. LuciaSt. Vincent and the GrenadinesSub-Saharan Africa Sub-Saharan Africa (excluding high income)Sub-Saharan Africa (IDA & IBRD countries)SudanSurinameSwazilandSwedenSwitzerlandSyrian Arab RepublicTajikistanTanzaniaThailandTimor-LesteTogoTongaTrinidad and TobagoTunisiaTurkeyTurkmenistanTuvaluUgandaUkraineUnited KingdomUnited StatesUpper middle incomeUruguayVanuatuVenezuela, RBVietnamWest Bank and GazaWorldYemen, Rep.ZambiaZimbabwe Timeline:
This timeline shows a graph from 1971 to 2016 of Sweden. No data until 1970. Number of actual observations by date: 46.
Source name:
World Development Indicators
Source organization:
World Bank staff estimates based on IMF balance of payments data.
Categories, topics:
Economy & Growth, Financial Sector
Last updated:
apr 23, 2017
Indicators value changes by year
Minimum:
25.129 mln
jan 1, 1971
Maximum:
1.623 bln
jan 1, 2014
At the date of observation
Value
Absolute change
Change from previous value
jan 1, 1971
25.129 mln
+25.129 mln
0.0%
jan 1, 1972
27.312 mln
+2.183 mln
8.69%
jan 1, 1973
31.497 mln
+4.184 mln
15.32%
jan 1, 1974
45.795 mln
+14.299 mln
45.4%
jan 1, 1975
38.293 mln
-7.502 mln
-16.38%
jan 1, 1976
52.879 mln
+14.586 mln
38.09%
jan 1, 1977
75.855 mln
+22.976 mln
43.45%
jan 1, 1978
102.376 mln
+26.52 mln
34.96%
jan 1, 1979
68.633 mln
-33.743 mln
-32.96%
jan 1, 1980
74.752 mln
+6.119 mln
8.92%
jan 1, 1981
82.767 mln
+8.016 mln
10.72%
jan 1, 1982
80.939 mln
-1.828 mln
-2.21%
jan 1, 1983
137.168 mln
+56.229 mln
69.47%
jan 1, 1984
238.072 mln
+100.904 mln
73.56%
jan 1, 1985
235.56 mln
-2.512 mln
-1.06%
jan 1, 1986
290.195 mln
+54.635 mln
23.19%
jan 1, 1987
337.916 mln
+47.72 mln
16.44%
jan 1, 1988
367.125 mln
+29.21 mln
8.64%
jan 1, 1989
485.334 mln
+118.208 mln
32.2%
jan 1, 1990
554.539 mln
+69.205 mln
14.26%
jan 1, 1991
653.516 mln
+98.977 mln
17.85%
jan 1, 1992
461.355 mln
-192.161 mln
-29.4%
jan 1, 1993
350.434 mln
-110.921 mln
-24.04%
jan 1, 1994
260.301 mln
-90.133 mln
-25.72%
jan 1, 1995
230.672 mln
-29.629 mln
-11.38%
jan 1, 1996
335.607 mln
+104.935 mln
45.49%
jan 1, 1997
428.488 mln
+92.881 mln
27.68%
jan 1, 1998
410.452 mln
-18.036 mln
-4.21%
jan 1, 1999
503.213 mln
+92.761 mln
22.6%
jan 1, 2000
484.308 mln
-18.905 mln
-3.76%
jan 1, 2001
538.813 mln
+54.504 mln
11.25%
jan 1, 2002
578.107 mln
+39.295 mln
7.29%
jan 1, 2003
507.652 mln
-70.455 mln
-12.19%
jan 1, 2004
495.585 mln
-12.068 mln
-2.38%
jan 1, 2005
544.899 mln
+49.315 mln
9.95%
jan 1, 2006
728.975 mln
+184.076 mln
33.78%
jan 1, 2007
930.17 mln
+201.194 mln
27.6%
jan 1, 2008
1.056 bln
+125.482 mln
13.49%
jan 1, 2009
1.206 bln
+150.106 mln
14.22%
jan 1, 2010
1.071 bln
-134.291 mln
-11.14%
jan 1, 2011
1.16 bln
+88.564 mln
8.27%
jan 1, 2012
1.39 bln
+229.914 mln
19.82%
jan 1, 2013
1.387 bln
-3.3 mln
-0.24%
jan 1, 2014
1.623 bln
+236.744 mln
17.07%
jan 1, 2015
1.584 bln
-39.744 mln
-2.45%
jan 1, 2016
1.242 bln
-341.769 mln
-21.58%
Ranking of countries by current statistics by years


Comments: