29
/
en
AIzaSyAYiBZKx7MnpbEhh9jyipgxe19OcubqV5w
April 1, 2024
170367
Korea, Rep.
KOR
true
2
1
Personal remittances, paid (current US$)
2016,2015,2014,2013,2012,2011,2010,2009,2008,2007,2006,2005,2004,2003,2002,2001,2000,1999,1998,1997,1996,1995,1994,1993,1992,1991,1990,1989,1988,1987,1986,1985,1984,1983,1982,1981,1980,1979,1978,1977
This statistics in other country:
AfghanistanAlbaniaAlgeriaAngolaAntigua and BarbudaArab WorldArgentinaArmeniaArubaAustraliaAustriaAzerbaijanBahamas, TheBahrainBangladeshBarbadosBelarusBelgiumBelizeBeninBermudaBhutanBoliviaBosnia and HerzegovinaBotswanaBrazilBrunei DarussalamBulgariaBurkina FasoBurundiCabo VerdeCambodiaCameroonCanadaCaribbean small statesCentral African RepublicCentral Europe and the BalticsChadChileChinaColombiaComorosCongo, Dem. Rep.Congo, Rep.Costa RicaCote d'IvoireCroatiaCuracaoCyprusCzech RepublicDenmarkDjiboutiDominicaDominican RepublicEarly-demographic dividendEast Asia & PacificEast Asia & Pacific (excluding high income)East Asia & Pacific (IDA & IBRD countries)EcuadorEgypt, Arab Rep.El SalvadorEquatorial GuineaEritreaEstoniaEthiopiaEuro areaEurope & Central AsiaEurope & Central Asia (excluding high income)Europe & Central Asia (IDA & IBRD countries)European UnionFaroe IslandsFijiFinlandFragile and conflict affected situationsFranceFrench PolynesiaGabonGambia, TheGeorgiaGermanyGhanaGreeceGrenadaGuatemalaGuineaGuinea-BissauGuyanaHaitiHeavily indebted poor countries (HIPC)High incomeHondurasHong Kong SAR, ChinaHungaryIBRD onlyIcelandIDA & IBRD totalIDA blendIDA onlyIDA totalIndiaIndonesiaIraqIrelandIsraelItalyJamaicaJapanJordanKazakhstanKenyaKiribatiKorea, Rep.KosovoKuwaitKyrgyz RepublicLao PDRLate-demographic dividendLatin America & Caribbean Latin America & Caribbean (excluding high income)Latin America & the Caribbean (IDA & IBRD countries)LatviaLeast developed countries: UN classificationLebanonLesothoLiberiaLibyaLithuaniaLow & middle incomeLow incomeLower middle incomeLuxembourgMacao SAR, ChinaMacedonia, FYRMadagascarMalawiMalaysiaMaldivesMaliMaltaMarshall IslandsMauritaniaMauritiusMexicoMicronesia, Fed. Sts.Middle East & North AfricaMiddle East & North Africa (excluding high income)Middle East & North Africa (IDA & IBRD countries)Middle incomeMoldovaMongoliaMontenegroMoroccoMozambiqueMyanmarNamibiaNepalNetherlandsNew CaledoniaNew ZealandNicaraguaNigerNigeriaNorth AmericaNorwayOECD membersOmanOther small statesPacific island small statesPakistanPalauPanamaPapua New GuineaParaguayPeruPhilippinesPolandPortugalPost-demographic dividendPre-demographic dividendQatarRomaniaRussian FederationRwandaSamoaSao Tome and PrincipeSaudi ArabiaSenegalSerbiaSeychellesSierra LeoneSint Maarten (Dutch part)Slovak RepublicSloveniaSmall statesSolomon IslandsSomaliaSouth AfricaSouth AsiaSouth Asia (IDA & IBRD)South SudanSpainSri LankaSt. Kitts and NevisSt. LuciaSt. Vincent and the GrenadinesSub-Saharan Africa Sub-Saharan Africa (excluding high income)Sub-Saharan Africa (IDA & IBRD countries)SudanSurinameSwazilandSwedenSwitzerlandSyrian Arab RepublicTajikistanTanzaniaThailandTimor-LesteTogoTongaTrinidad and TobagoTunisiaTurkeyTurkmenistanTuvaluUgandaUkraineUnited KingdomUnited StatesUpper middle incomeUruguayVanuatuVenezuela, RBVietnamWest Bank and GazaWorldYemen, Rep.ZambiaZimbabwe Timeline:
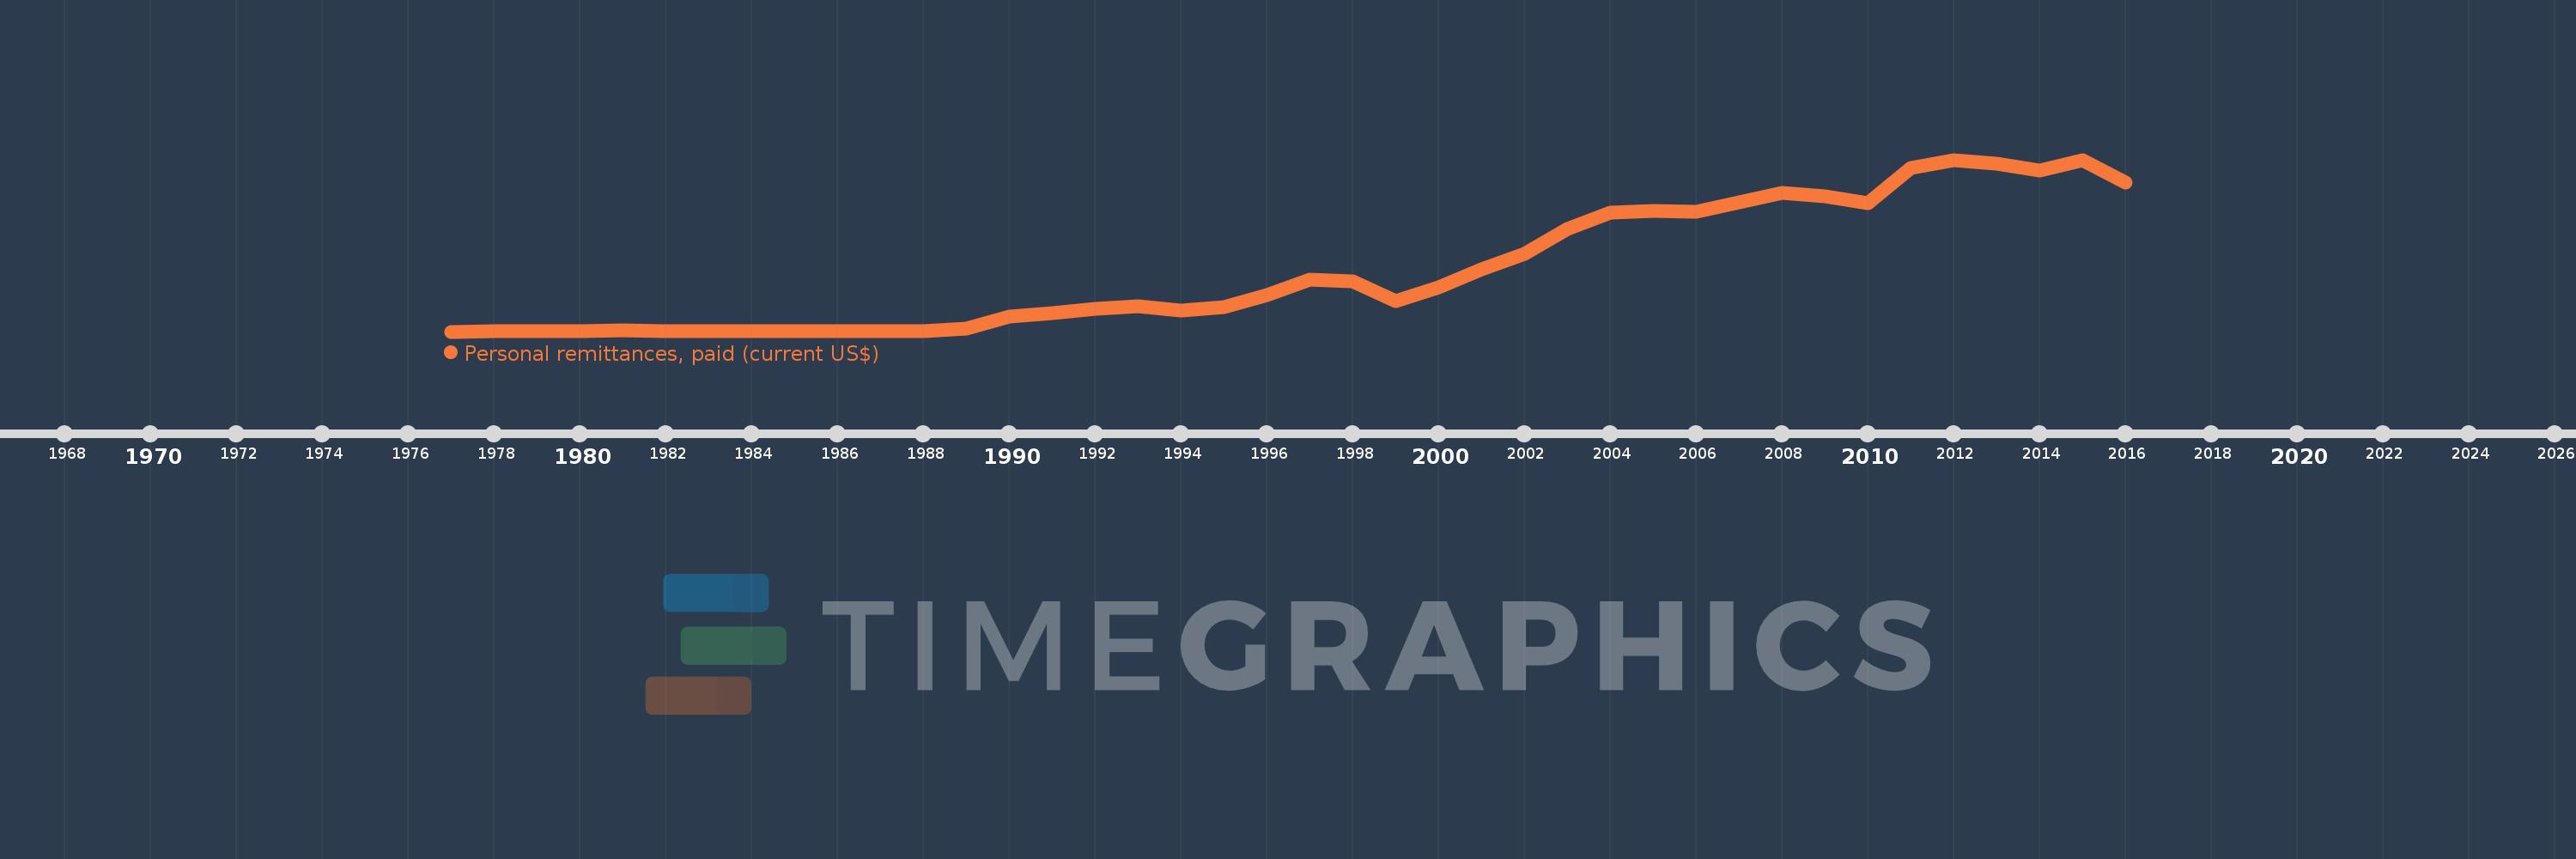
This timeline shows a graph from 1977 to 2016 of Korea, Rep.. No data until 1976. Number of actual observations by date: 40.
Source name:
World Development Indicators
Source organization:
World Bank staff estimates based on IMF balance of payments data.
Categories, topics:
Economy & Growth, Financial Sector
Last updated:
apr 23, 2017
Indicators value changes by year
Minimum:
1000.0K
jan 1, 1977
Maximum:
9.586 bln
jan 1, 2012
At the date of observation
Value
Absolute change
Change from previous value
jan 1, 1977
1000.0K
+1000.0K
0.0%
jan 1, 1978
2.0 mln
+1000.0K
100.0%
jan 1, 1979
3.0 mln
+1000.0K
50.0%
jan 1, 1980
4.0 mln
+1000.0K
33.33%
jan 1, 1981
57.7 mln
+53.7 mln
1.34K%
jan 1, 1982
33.3 mln
-24.4 mln
-42.29%
jan 1, 1983
26.8 mln
-6.5 mln
-19.52%
jan 1, 1984
21.4 mln
-5.4 mln
-20.15%
jan 1, 1985
36.6 mln
+15.2 mln
71.03%
jan 1, 1986
27.0 mln
-9.6 mln
-26.23%
jan 1, 1987
36.5 mln
+9.5 mln
35.19%
jan 1, 1988
33.9 mln
-2.6 mln
-7.12%
jan 1, 1989
154.8 mln
+120.9 mln
356.64%
jan 1, 1990
821.4 mln
+666.6 mln
430.62%
jan 1, 1991
1.028 bln
+206.9 mln
25.19%
jan 1, 1992
1.275 bln
+246.9 mln
24.01%
jan 1, 1993
1.409 bln
+133.6 mln
10.48%
jan 1, 1994
1.179 bln
-230.2 mln
-16.34%
jan 1, 1995
1.351 bln
+172.4 mln
14.63%
jan 1, 1996
2.062 bln
+710.7 mln
52.61%
jan 1, 1997
2.899 bln
+837.3 mln
40.61%
jan 1, 1998
2.799 bln
-100.1 mln
-3.45%
jan 1, 1999
1.68 bln
-1.119 bln
-39.98%
jan 1, 2000
2.487 bln
+806.8 mln
48.02%
jan 1, 2001
3.471 bln
+984.5 mln
39.59%
jan 1, 2002
4.336 bln
+864.9 mln
24.92%
jan 1, 2003
5.705 bln
+1.369 bln
31.57%
jan 1, 2004
6.628 bln
+923.4 mln
16.19%
jan 1, 2005
6.731 bln
+102.7 mln
1.55%
jan 1, 2006
6.667 bln
-63.8 mln
-0.95%
jan 1, 2007
7.215 bln
+547.8 mln
8.22%
jan 1, 2008
7.723 bln
+508.0 mln
7.04%
jan 1, 2009
7.545 bln
-177.9 mln
-2.3%
jan 1, 2010
7.153 bln
-392.5 mln
-5.2%
jan 1, 2011
9.123 bln
+1.97 bln
27.55%
jan 1, 2012
9.586 bln
+462.9 mln
5.07%
jan 1, 2013
9.38 bln
-205.6 mln
-2.14%
jan 1, 2014
8.991 bln
-389.4 mln
-4.15%
jan 1, 2015
9.57 bln
+579.6 mln
6.45%
jan 1, 2016
8.321 bln
-1.249 bln
-13.05%
Ranking of countries by current statistics by years


Comments: