29
/
en
AIzaSyAYiBZKx7MnpbEhh9jyipgxe19OcubqV5w
April 1, 2024
61094
Sub-Saharan Africa (IDA & IBRD countries)
TSS
false
2
1
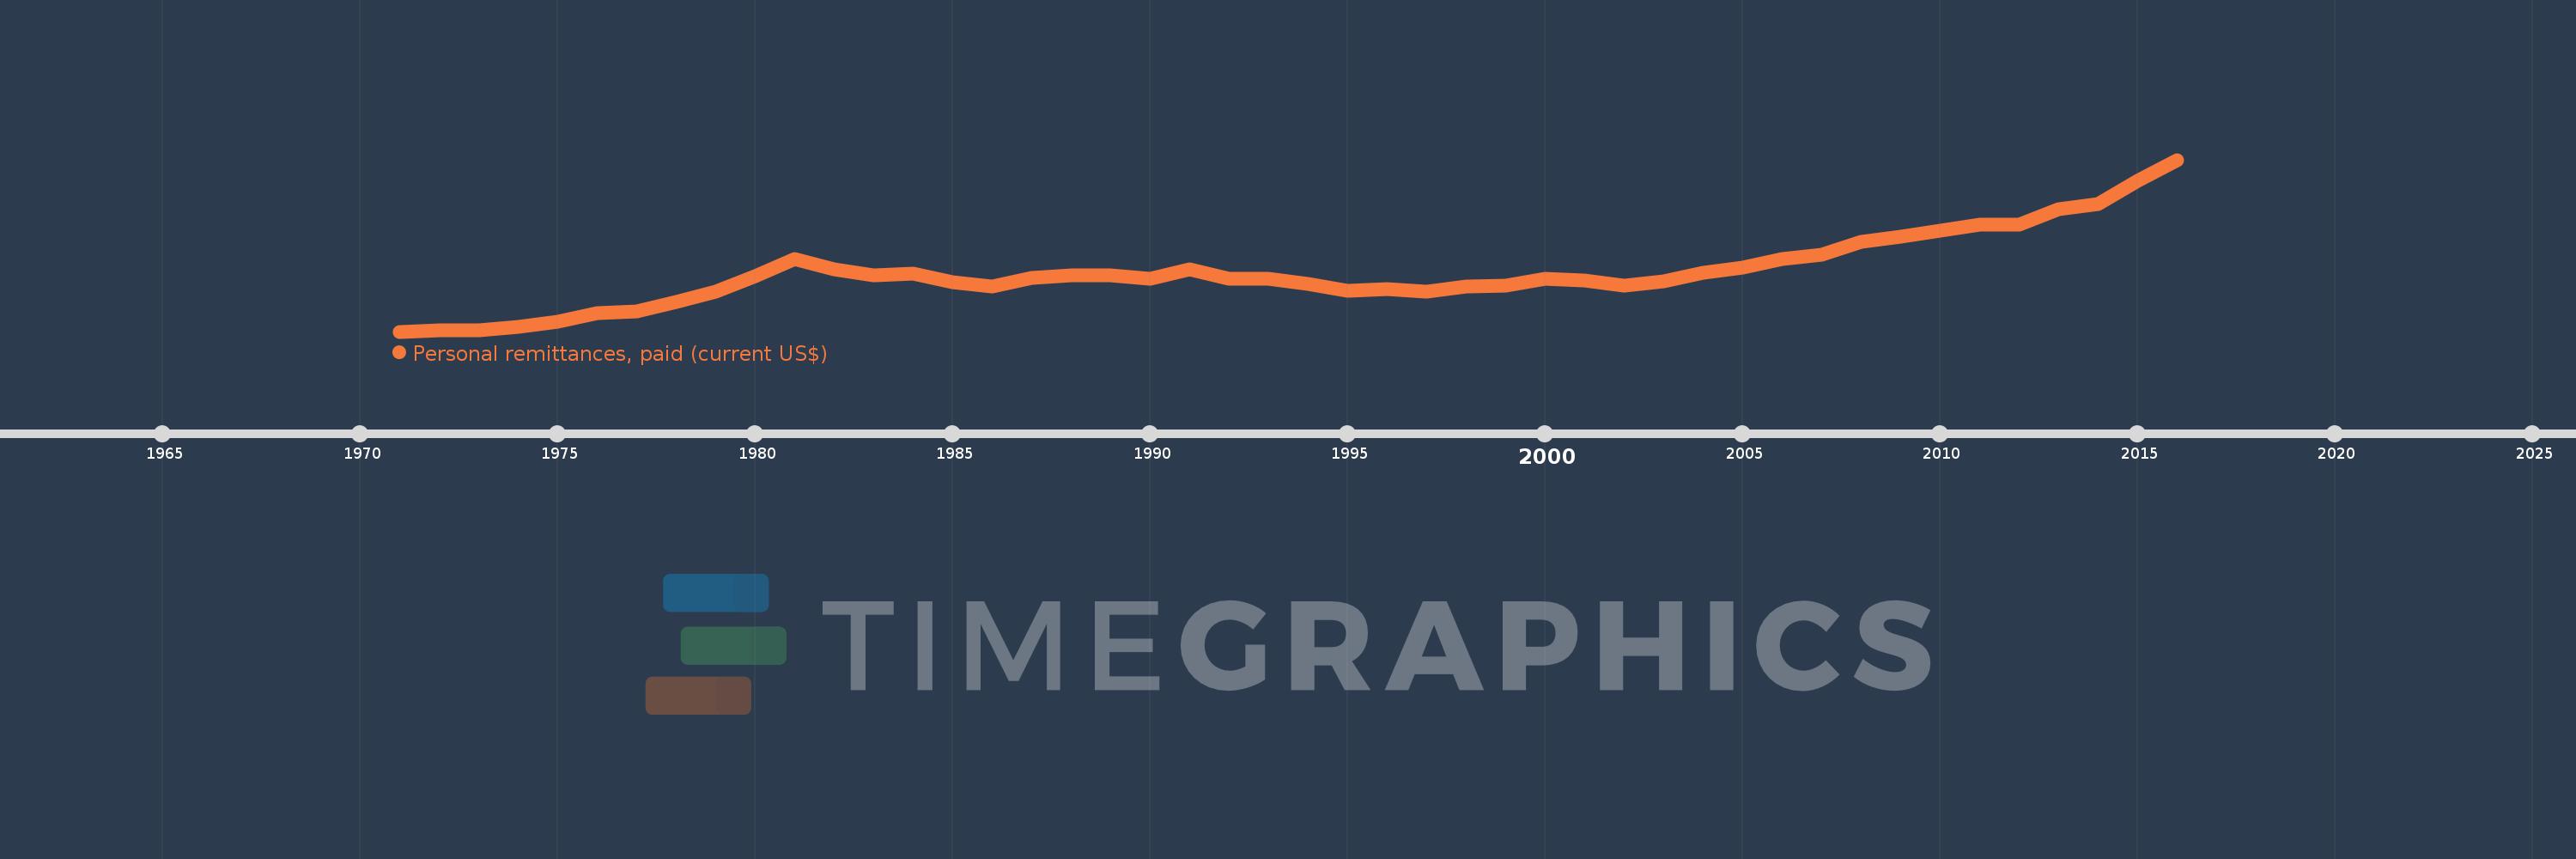
Personal remittances, paid (current US$)
2016,2015,2014,2013,2012,2011,2010,2009,2008,2007,2006,2005,2004,2003,2002,2001,2000,1999,1998,1997,1996,1995,1994,1993,1992,1991,1990,1989,1988,1987,1986,1985,1984,1983,1982,1981,1980,1979,1978,1977,1976,1975,1974,1973,1972,1971
This statistics in other country:
AfghanistanAlbaniaAlgeriaAngolaAntigua and BarbudaArab WorldArgentinaArmeniaArubaAustraliaAustriaAzerbaijanBahamas, TheBahrainBangladeshBarbadosBelarusBelgiumBelizeBeninBermudaBhutanBoliviaBosnia and HerzegovinaBotswanaBrazilBrunei DarussalamBulgariaBurkina FasoBurundiCabo VerdeCambodiaCameroonCanadaCaribbean small statesCentral African RepublicCentral Europe and the BalticsChadChileChinaColombiaComorosCongo, Dem. Rep.Congo, Rep.Costa RicaCote d'IvoireCroatiaCuracaoCyprusCzech RepublicDenmarkDjiboutiDominicaDominican RepublicEarly-demographic dividendEast Asia & PacificEast Asia & Pacific (excluding high income)East Asia & Pacific (IDA & IBRD countries)EcuadorEgypt, Arab Rep.El SalvadorEquatorial GuineaEritreaEstoniaEthiopiaEuro areaEurope & Central AsiaEurope & Central Asia (excluding high income)Europe & Central Asia (IDA & IBRD countries)European UnionFaroe IslandsFijiFinlandFragile and conflict affected situationsFranceFrench PolynesiaGabonGambia, TheGeorgiaGermanyGhanaGreeceGrenadaGuatemalaGuineaGuinea-BissauGuyanaHaitiHeavily indebted poor countries (HIPC)High incomeHondurasHong Kong SAR, ChinaHungaryIBRD onlyIcelandIDA & IBRD totalIDA blendIDA onlyIDA totalIndiaIndonesiaIraqIrelandIsraelItalyJamaicaJapanJordanKazakhstanKenyaKiribatiKorea, Rep.KosovoKuwaitKyrgyz RepublicLao PDRLate-demographic dividendLatin America & Caribbean Latin America & Caribbean (excluding high income)Latin America & the Caribbean (IDA & IBRD countries)LatviaLeast developed countries: UN classificationLebanonLesothoLiberiaLibyaLithuaniaLow & middle incomeLow incomeLower middle incomeLuxembourgMacao SAR, ChinaMacedonia, FYRMadagascarMalawiMalaysiaMaldivesMaliMaltaMarshall IslandsMauritaniaMauritiusMexicoMicronesia, Fed. Sts.Middle East & North AfricaMiddle East & North Africa (excluding high income)Middle East & North Africa (IDA & IBRD countries)Middle incomeMoldovaMongoliaMontenegroMoroccoMozambiqueMyanmarNamibiaNepalNetherlandsNew CaledoniaNew ZealandNicaraguaNigerNigeriaNorth AmericaNorwayOECD membersOmanOther small statesPacific island small statesPakistanPalauPanamaPapua New GuineaParaguayPeruPhilippinesPolandPortugalPost-demographic dividendPre-demographic dividendQatarRomaniaRussian FederationRwandaSamoaSao Tome and PrincipeSaudi ArabiaSenegalSerbiaSeychellesSierra LeoneSint Maarten (Dutch part)Slovak RepublicSloveniaSmall statesSolomon IslandsSomaliaSouth AfricaSouth AsiaSouth Asia (IDA & IBRD)South SudanSpainSri LankaSt. Kitts and NevisSt. LuciaSt. Vincent and the GrenadinesSub-Saharan Africa Sub-Saharan Africa (excluding high income)Sub-Saharan Africa (IDA & IBRD countries)SudanSurinameSwazilandSwedenSwitzerlandSyrian Arab RepublicTajikistanTanzaniaThailandTimor-LesteTogoTongaTrinidad and TobagoTunisiaTurkeyTurkmenistanTuvaluUgandaUkraineUnited KingdomUnited StatesUpper middle incomeUruguayVanuatuVenezuela, RBVietnamWest Bank and GazaWorldYemen, Rep.ZambiaZimbabwe Timeline:
This timeline shows a graph from 1971 to 2016 of Sub-Saharan Africa (IDA & IBRD countries). No data until 1970. Number of actual observations by date: 46.
Source name:
World Development Indicators
Source organization:
World Bank staff estimates based on IMF balance of payments data.
Categories, topics:
Economy & Growth, Financial Sector
Last updated:
apr 23, 2017
Indicators value changes by year
Minimum:
236.6 mln
jan 1, 1971
Maximum:
7.564 bln
jan 1, 2016
At the date of observation
Value
Absolute change
Change from previous value
jan 1, 1971
236.6 mln
+236.6 mln
0.0%
jan 1, 1972
283.822 mln
+47.222 mln
19.96%
jan 1, 1973
279.514 mln
-4.308 mln
-1.52%
jan 1, 1974
423.839 mln
+144.325 mln
51.63%
jan 1, 1975
653.046 mln
+229.207 mln
54.08%
jan 1, 1976
1.031 bln
+377.516 mln
57.81%
jan 1, 1977
1.095 bln
+64.566 mln
6.27%
jan 1, 1978
1.483 bln
+388.246 mln
35.45%
jan 1, 1979
1.926 bln
+443.087 mln
29.87%
jan 1, 1980
2.596 bln
+669.866 mln
34.77%
jan 1, 1981
3.345 bln
+749.01 mln
28.85%
jan 1, 1982
2.908 bln
-437.494 mln
-13.08%
jan 1, 1983
2.627 bln
-281.242 mln
-9.67%
jan 1, 1984
2.699 bln
+72.714 mln
2.77%
jan 1, 1985
2.359 bln
-340.179 mln
-12.6%
jan 1, 1986
2.168 bln
-191.099 mln
-8.1%
jan 1, 1987
2.527 bln
+359.283 mln
16.57%
jan 1, 1988
2.639 bln
+111.288 mln
4.4%
jan 1, 1989
2.627 bln
-11.294 mln
-0.43%
jan 1, 1990
2.48 bln
-147.072 mln
-5.6%
jan 1, 1991
2.875 bln
+394.753 mln
15.92%
jan 1, 1992
2.48 bln
-395.183 mln
-13.75%
jan 1, 1993
2.506 bln
+25.986 mln
1.05%
jan 1, 1994
2.28 bln
-226.091 mln
-9.02%
jan 1, 1995
1.964 bln
-315.421 mln
-13.84%
jan 1, 1996
2.06 bln
+95.899 mln
4.88%
jan 1, 1997
1.956 bln
-104.366 mln
-5.07%
jan 1, 1998
2.143 bln
+187.471 mln
9.59%
jan 1, 1999
2.199 bln
+55.819 mln
2.6%
jan 1, 2000
2.494 bln
+294.909 mln
13.41%
jan 1, 2001
2.406 bln
-87.966 mln
-3.53%
jan 1, 2002
2.21 bln
-195.765 mln
-8.14%
jan 1, 2003
2.386 bln
+175.54 mln
7.94%
jan 1, 2004
2.743 bln
+357.509 mln
14.98%
jan 1, 2005
2.965 bln
+221.351 mln
8.07%
jan 1, 2006
3.328 bln
+363.577 mln
12.26%
jan 1, 2007
3.534 bln
+205.646 mln
6.18%
jan 1, 2008
4.083 bln
+548.98 mln
15.53%
jan 1, 2009
4.28 bln
+196.776 mln
4.82%
jan 1, 2010
4.545 bln
+265.507 mln
6.2%
jan 1, 2011
4.79 bln
+245.186 mln
5.39%
jan 1, 2012
4.804 bln
+13.3 mln
0.28%
jan 1, 2013
5.452 bln
+648.377 mln
13.5%
jan 1, 2014
5.674 bln
+221.629 mln
4.07%
jan 1, 2015
6.652 bln
+978.57 mln
17.25%
jan 1, 2016
7.564 bln
+911.823 mln
13.71%
Ranking of countries by current statistics by years


Comments: