29
/
en
AIzaSyAYiBZKx7MnpbEhh9jyipgxe19OcubqV5w
April 1, 2024
38484
IDA blend
IDB
false
2
1
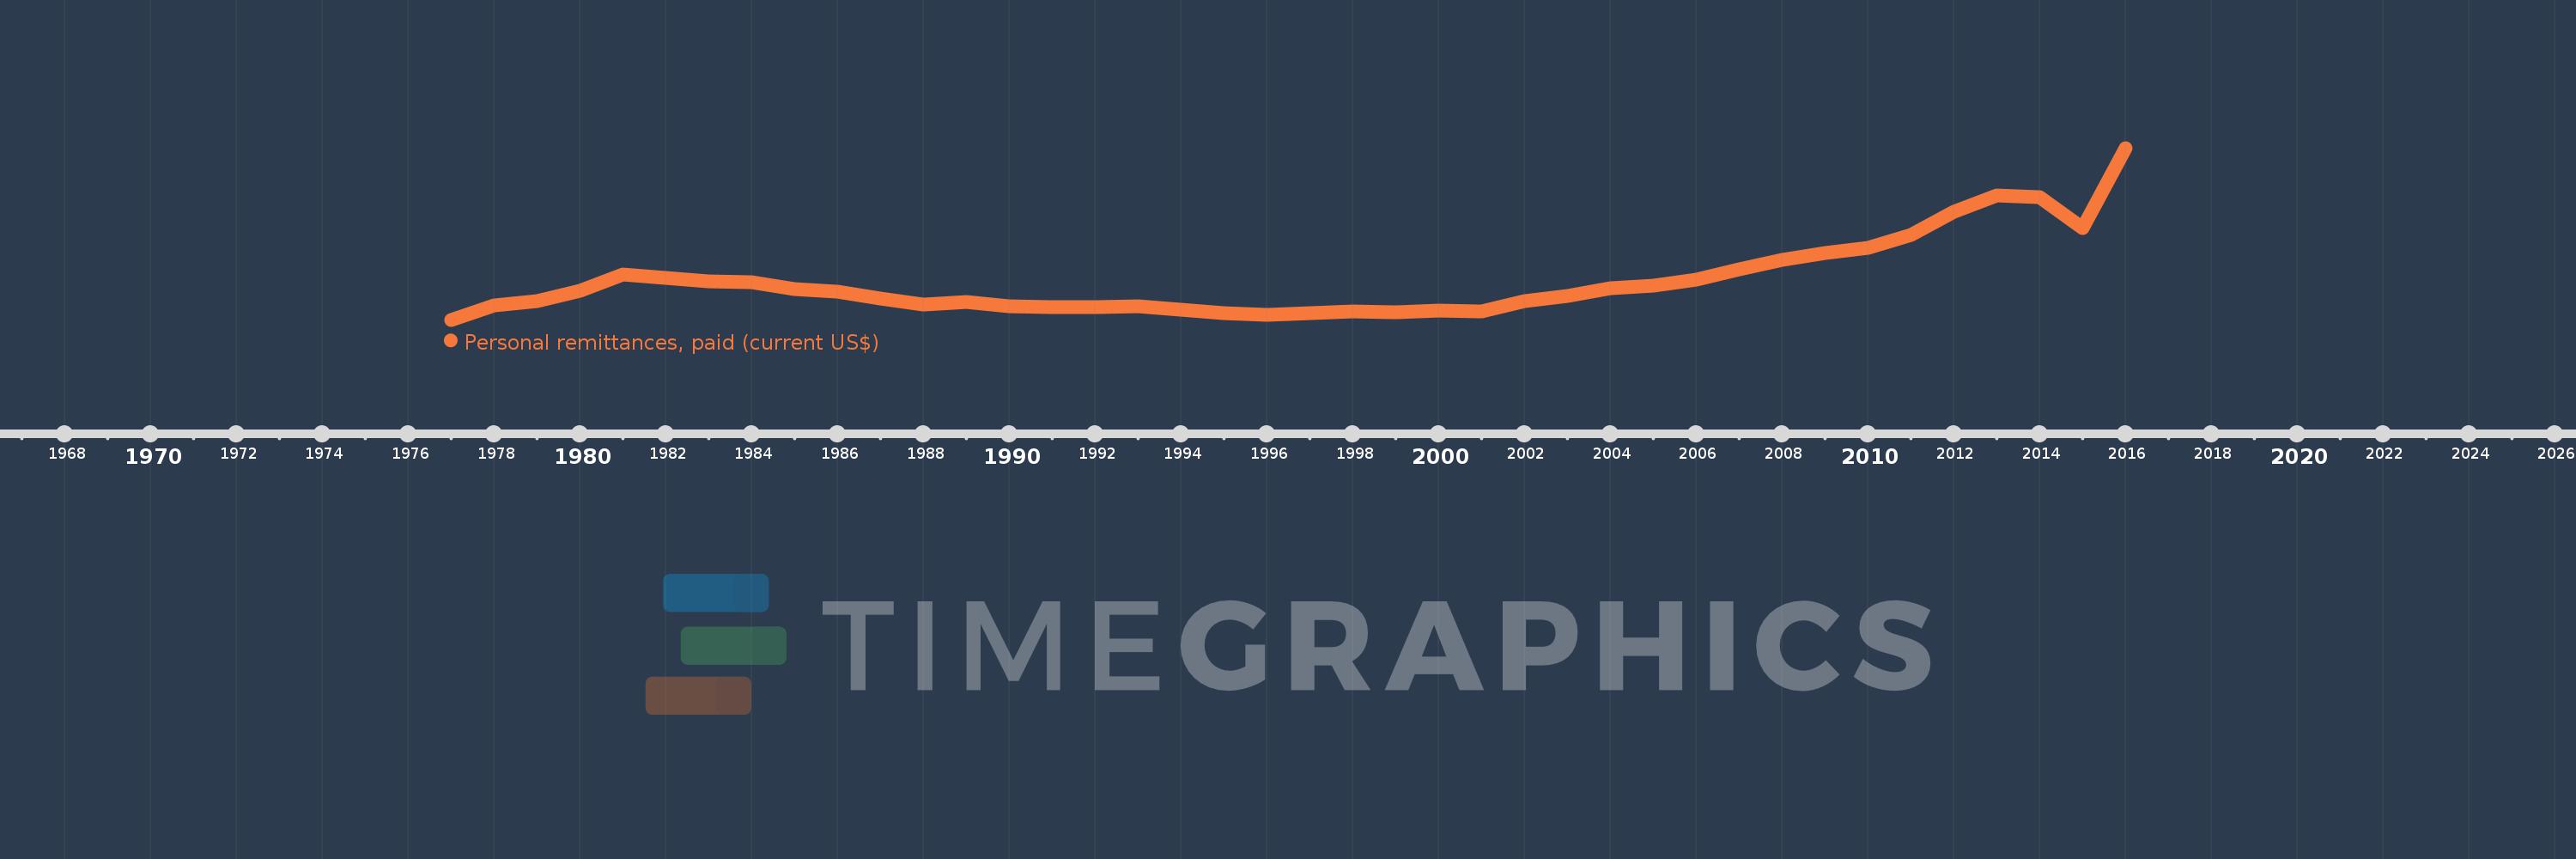
Personal remittances, paid (current US$)
2016,2015,2014,2013,2012,2011,2010,2009,2008,2007,2006,2005,2004,2003,2002,2001,2000,1999,1998,1997,1996,1995,1994,1993,1992,1991,1990,1989,1988,1987,1986,1985,1984,1983,1982,1981,1980,1979,1978,1977
This statistics in other country:
AfghanistanAlbaniaAlgeriaAngolaAntigua and BarbudaArab WorldArgentinaArmeniaArubaAustraliaAustriaAzerbaijanBahamas, TheBahrainBangladeshBarbadosBelarusBelgiumBelizeBeninBermudaBhutanBoliviaBosnia and HerzegovinaBotswanaBrazilBrunei DarussalamBulgariaBurkina FasoBurundiCabo VerdeCambodiaCameroonCanadaCaribbean small statesCentral African RepublicCentral Europe and the BalticsChadChileChinaColombiaComorosCongo, Dem. Rep.Congo, Rep.Costa RicaCote d'IvoireCroatiaCuracaoCyprusCzech RepublicDenmarkDjiboutiDominicaDominican RepublicEarly-demographic dividendEast Asia & PacificEast Asia & Pacific (excluding high income)East Asia & Pacific (IDA & IBRD countries)EcuadorEgypt, Arab Rep.El SalvadorEquatorial GuineaEritreaEstoniaEthiopiaEuro areaEurope & Central AsiaEurope & Central Asia (excluding high income)Europe & Central Asia (IDA & IBRD countries)European UnionFaroe IslandsFijiFinlandFragile and conflict affected situationsFranceFrench PolynesiaGabonGambia, TheGeorgiaGermanyGhanaGreeceGrenadaGuatemalaGuineaGuinea-BissauGuyanaHaitiHeavily indebted poor countries (HIPC)High incomeHondurasHong Kong SAR, ChinaHungaryIBRD onlyIcelandIDA & IBRD totalIDA blendIDA onlyIDA totalIndiaIndonesiaIraqIrelandIsraelItalyJamaicaJapanJordanKazakhstanKenyaKiribatiKorea, Rep.KosovoKuwaitKyrgyz RepublicLao PDRLate-demographic dividendLatin America & Caribbean Latin America & Caribbean (excluding high income)Latin America & the Caribbean (IDA & IBRD countries)LatviaLeast developed countries: UN classificationLebanonLesothoLiberiaLibyaLithuaniaLow & middle incomeLow incomeLower middle incomeLuxembourgMacao SAR, ChinaMacedonia, FYRMadagascarMalawiMalaysiaMaldivesMaliMaltaMarshall IslandsMauritaniaMauritiusMexicoMicronesia, Fed. Sts.Middle East & North AfricaMiddle East & North Africa (excluding high income)Middle East & North Africa (IDA & IBRD countries)Middle incomeMoldovaMongoliaMontenegroMoroccoMozambiqueMyanmarNamibiaNepalNetherlandsNew CaledoniaNew ZealandNicaraguaNigerNigeriaNorth AmericaNorwayOECD membersOmanOther small statesPacific island small statesPakistanPalauPanamaPapua New GuineaParaguayPeruPhilippinesPolandPortugalPost-demographic dividendPre-demographic dividendQatarRomaniaRussian FederationRwandaSamoaSao Tome and PrincipeSaudi ArabiaSenegalSerbiaSeychellesSierra LeoneSint Maarten (Dutch part)Slovak RepublicSloveniaSmall statesSolomon IslandsSomaliaSouth AfricaSouth AsiaSouth Asia (IDA & IBRD)South SudanSpainSri LankaSt. Kitts and NevisSt. LuciaSt. Vincent and the GrenadinesSub-Saharan Africa Sub-Saharan Africa (excluding high income)Sub-Saharan Africa (IDA & IBRD countries)SudanSurinameSwazilandSwedenSwitzerlandSyrian Arab RepublicTajikistanTanzaniaThailandTimor-LesteTogoTongaTrinidad and TobagoTunisiaTurkeyTurkmenistanTuvaluUgandaUkraineUnited KingdomUnited StatesUpper middle incomeUruguayVanuatuVenezuela, RBVietnamWest Bank and GazaWorldYemen, Rep.ZambiaZimbabwe Timeline:
This timeline shows a graph from 1977 to 2016 of IDA blend. No data until 1976. Number of actual observations by date: 40.
Source name:
World Development Indicators
Source organization:
World Bank staff estimates based on IMF balance of payments data.
Categories, topics:
Economy & Growth, Financial Sector
Last updated:
apr 23, 2017
Indicators value changes by year
Minimum:
26.665 mln
jan 1, 1977
Maximum:
3.102 bln
jan 1, 2016
At the date of observation
Value
Absolute change
Change from previous value
jan 1, 1977
26.665 mln
+26.665 mln
0.0%
jan 1, 1978
276.556 mln
+249.89 mln
937.13%
jan 1, 1979
360.182 mln
+83.626 mln
30.24%
jan 1, 1980
546.467 mln
+186.285 mln
51.72%
jan 1, 1981
832.892 mln
+286.425 mln
52.41%
jan 1, 1982
780.068 mln
-52.824 mln
-6.34%
jan 1, 1983
715.04 mln
-65.027 mln
-8.34%
jan 1, 1984
691.386 mln
-23.654 mln
-3.31%
jan 1, 1985
582.252 mln
-109.135 mln
-15.78%
jan 1, 1986
532.647 mln
-49.604 mln
-8.52%
jan 1, 1987
408.572 mln
-124.075 mln
-23.29%
jan 1, 1988
296.0 mln
-112.571 mln
-27.55%
jan 1, 1989
346.044 mln
+50.043 mln
16.91%
jan 1, 1990
268.004 mln
-78.04 mln
-22.55%
jan 1, 1991
255.222 mln
-12.782 mln
-4.77%
jan 1, 1992
250.197 mln
-5.025 mln
-1.97%
jan 1, 1993
272.613 mln
+22.416 mln
8.96%
jan 1, 1994
206.236 mln
-66.377 mln
-24.35%
jan 1, 1995
149.326 mln
-56.91 mln
-27.59%
jan 1, 1996
112.862 mln
-36.464 mln
-24.42%
jan 1, 1997
149.848 mln
+36.986 mln
32.77%
jan 1, 1998
171.82 mln
+21.972 mln
14.66%
jan 1, 1999
164.892 mln
-6.929 mln
-4.03%
jan 1, 2000
193.182 mln
+28.29 mln
17.16%
jan 1, 2001
172.768 mln
-20.414 mln
-10.57%
jan 1, 2002
360.515 mln
+187.747 mln
108.67%
jan 1, 2003
451.602 mln
+91.087 mln
25.27%
jan 1, 2004
586.106 mln
+134.504 mln
29.78%
jan 1, 2005
630.116 mln
+44.011 mln
7.51%
jan 1, 2006
737.651 mln
+107.535 mln
17.07%
jan 1, 2007
932.323 mln
+194.672 mln
26.39%
jan 1, 2008
1.097 bln
+164.91 mln
17.69%
jan 1, 2009
1.215 bln
+117.352 mln
10.7%
jan 1, 2010
1.311 bln
+95.918 mln
7.9%
jan 1, 2011
1.548 bln
+237.803 mln
18.15%
jan 1, 2012
1.96 bln
+411.437 mln
26.57%
jan 1, 2013
2.248 bln
+288.531 mln
14.72%
jan 1, 2014
2.218 bln
-30.307 mln
-1.35%
jan 1, 2015
1.671 bln
-547.457 mln
-24.68%
jan 1, 2016
3.102 bln
+1.432 bln
85.71%
Ranking of countries by current statistics by years


Comments: