29
/
en
AIzaSyAYiBZKx7MnpbEhh9jyipgxe19OcubqV5w
April 1, 2024
215684
Oman
OMN
true
2
1
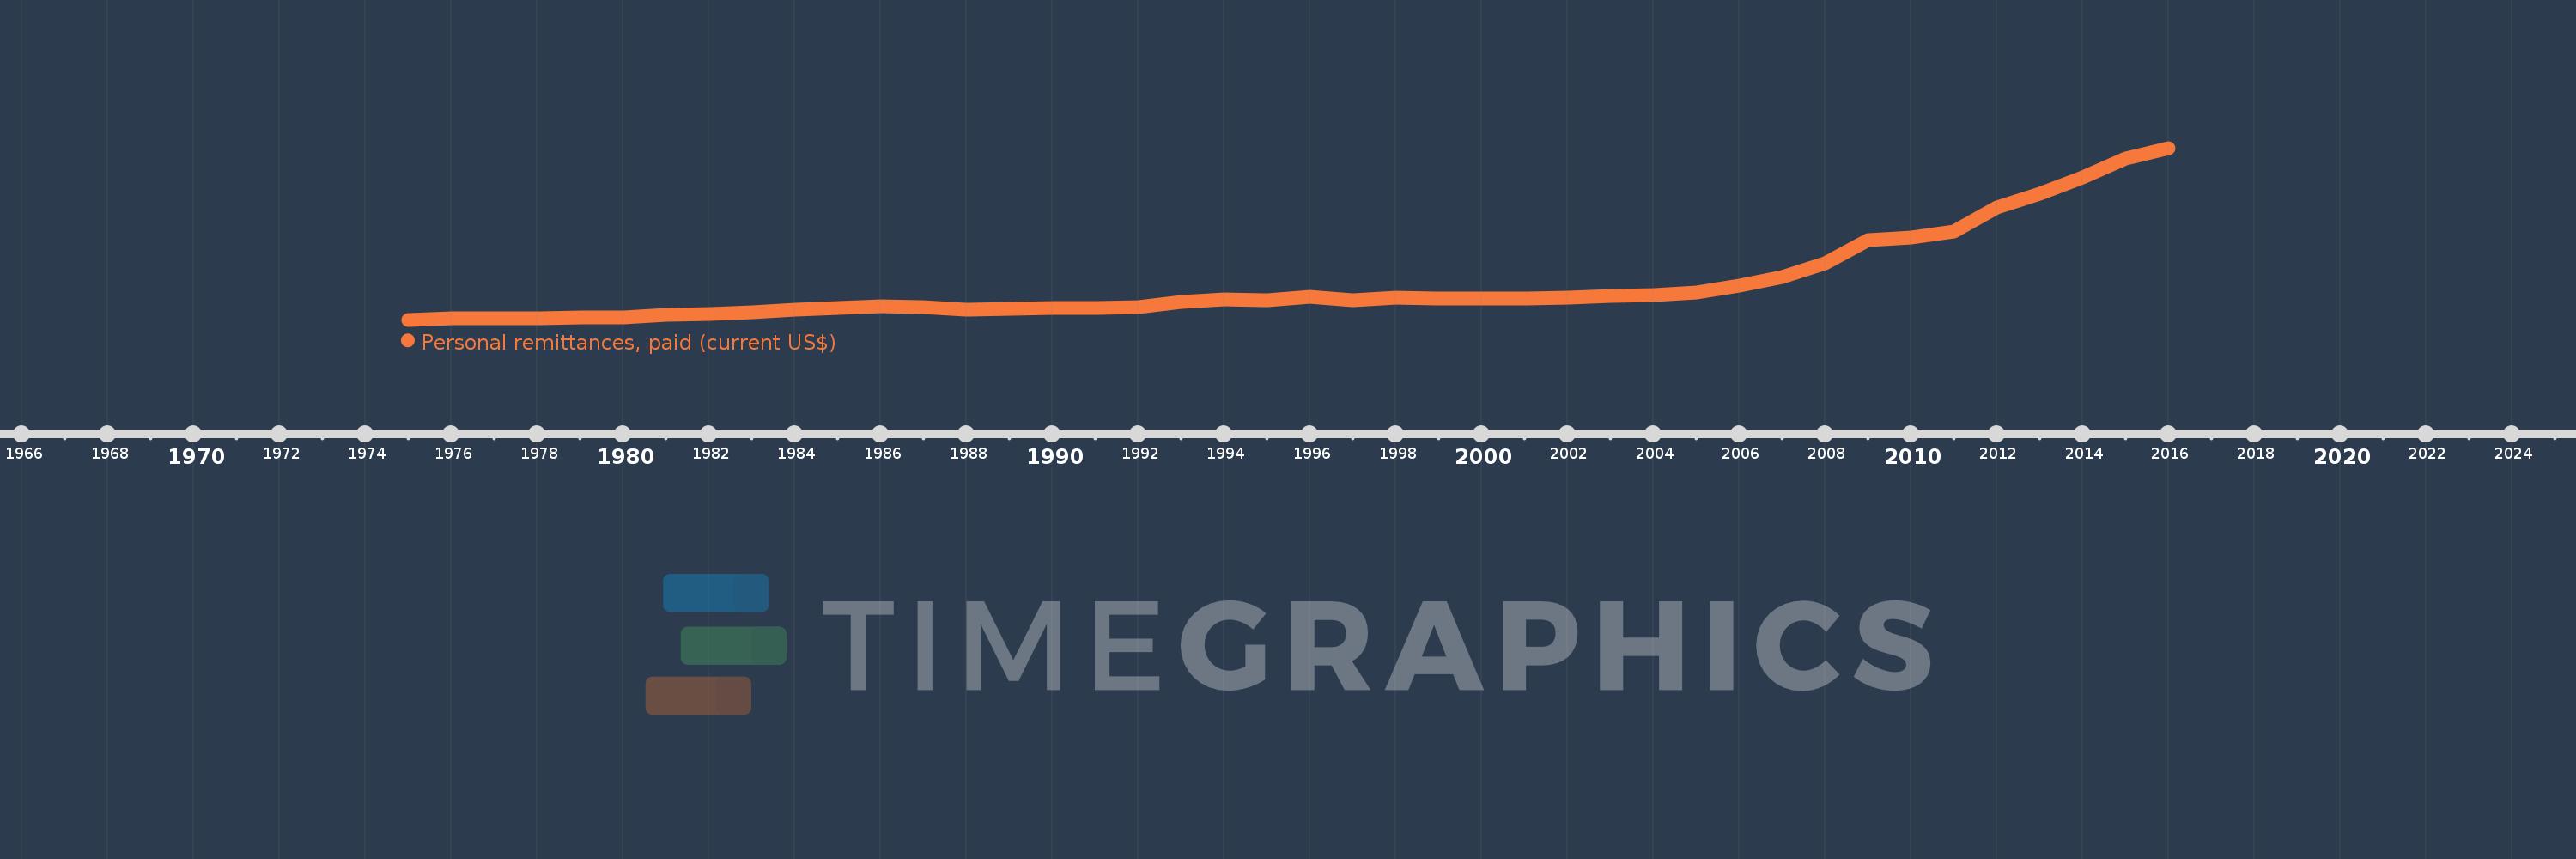
Personal remittances, paid (current US$)
2016,2015,2014,2013,2012,2011,2010,2009,2008,2007,2006,2005,2004,2003,2002,2001,2000,1999,1998,1997,1996,1995,1994,1993,1992,1991,1990,1989,1988,1987,1986,1985,1984,1983,1982,1981,1980,1979,1978,1977,1976,1975
This statistics in other country:
AfghanistanAlbaniaAlgeriaAngolaAntigua and BarbudaArab WorldArgentinaArmeniaArubaAustraliaAustriaAzerbaijanBahamas, TheBahrainBangladeshBarbadosBelarusBelgiumBelizeBeninBermudaBhutanBoliviaBosnia and HerzegovinaBotswanaBrazilBrunei DarussalamBulgariaBurkina FasoBurundiCabo VerdeCambodiaCameroonCanadaCaribbean small statesCentral African RepublicCentral Europe and the BalticsChadChileChinaColombiaComorosCongo, Dem. Rep.Congo, Rep.Costa RicaCote d'IvoireCroatiaCuracaoCyprusCzech RepublicDenmarkDjiboutiDominicaDominican RepublicEarly-demographic dividendEast Asia & PacificEast Asia & Pacific (excluding high income)East Asia & Pacific (IDA & IBRD countries)EcuadorEgypt, Arab Rep.El SalvadorEquatorial GuineaEritreaEstoniaEthiopiaEuro areaEurope & Central AsiaEurope & Central Asia (excluding high income)Europe & Central Asia (IDA & IBRD countries)European UnionFaroe IslandsFijiFinlandFragile and conflict affected situationsFranceFrench PolynesiaGabonGambia, TheGeorgiaGermanyGhanaGreeceGrenadaGuatemalaGuineaGuinea-BissauGuyanaHaitiHeavily indebted poor countries (HIPC)High incomeHondurasHong Kong SAR, ChinaHungaryIBRD onlyIcelandIDA & IBRD totalIDA blendIDA onlyIDA totalIndiaIndonesiaIraqIrelandIsraelItalyJamaicaJapanJordanKazakhstanKenyaKiribatiKorea, Rep.KosovoKuwaitKyrgyz RepublicLao PDRLate-demographic dividendLatin America & Caribbean Latin America & Caribbean (excluding high income)Latin America & the Caribbean (IDA & IBRD countries)LatviaLeast developed countries: UN classificationLebanonLesothoLiberiaLibyaLithuaniaLow & middle incomeLow incomeLower middle incomeLuxembourgMacao SAR, ChinaMacedonia, FYRMadagascarMalawiMalaysiaMaldivesMaliMaltaMarshall IslandsMauritaniaMauritiusMexicoMicronesia, Fed. Sts.Middle East & North AfricaMiddle East & North Africa (excluding high income)Middle East & North Africa (IDA & IBRD countries)Middle incomeMoldovaMongoliaMontenegroMoroccoMozambiqueMyanmarNamibiaNepalNetherlandsNew CaledoniaNew ZealandNicaraguaNigerNigeriaNorth AmericaNorwayOECD membersOmanOther small statesPacific island small statesPakistanPalauPanamaPapua New GuineaParaguayPeruPhilippinesPolandPortugalPost-demographic dividendPre-demographic dividendQatarRomaniaRussian FederationRwandaSamoaSao Tome and PrincipeSaudi ArabiaSenegalSerbiaSeychellesSierra LeoneSint Maarten (Dutch part)Slovak RepublicSloveniaSmall statesSolomon IslandsSomaliaSouth AfricaSouth AsiaSouth Asia (IDA & IBRD)South SudanSpainSri LankaSt. Kitts and NevisSt. LuciaSt. Vincent and the GrenadinesSub-Saharan Africa Sub-Saharan Africa (excluding high income)Sub-Saharan Africa (IDA & IBRD countries)SudanSurinameSwazilandSwedenSwitzerlandSyrian Arab RepublicTajikistanTanzaniaThailandTimor-LesteTogoTongaTrinidad and TobagoTunisiaTurkeyTurkmenistanTuvaluUgandaUkraineUnited KingdomUnited StatesUpper middle incomeUruguayVanuatuVenezuela, RBVietnamWest Bank and GazaWorldYemen, Rep.ZambiaZimbabwe Timeline:
This timeline shows a graph from 1975 to 2016 of Oman. No data until 1974. Number of actual observations by date: 42.
Source name:
World Development Indicators
Source organization:
World Bank staff estimates based on IMF balance of payments data.
Categories, topics:
Economy & Growth, Financial Sector
Last updated:
apr 23, 2017
Indicators value changes by year
Minimum:
110.886 mln
jan 1, 1975
Maximum:
10.991 bln
jan 1, 2016
At the date of observation
Value
Absolute change
Change from previous value
jan 1, 1975
110.886 mln
+110.886 mln
0.0%
jan 1, 1976
208.164 mln
+97.279 mln
87.73%
jan 1, 1977
219.745 mln
+11.581 mln
5.56%
jan 1, 1978
221.772 mln
+2.027 mln
0.92%
jan 1, 1979
241.17 mln
+19.398 mln
8.75%
jan 1, 1980
281.413 mln
+40.243 mln
16.69%
jan 1, 1981
396.642 mln
+115.229 mln
40.95%
jan 1, 1982
500.869 mln
+104.227 mln
26.28%
jan 1, 1983
599.305 mln
+98.437 mln
19.65%
jan 1, 1984
738.274 mln
+138.969 mln
23.19%
jan 1, 1985
862.774 mln
+124.5 mln
16.86%
jan 1, 1986
949.637 mln
+86.863 mln
10.07%
jan 1, 1987
884.859 mln
-64.779 mln
-6.82%
jan 1, 1988
741.222 mln
-143.636 mln
-16.23%
jan 1, 1989
801.04 mln
+59.818 mln
8.07%
jan 1, 1990
829.649 mln
+28.609 mln
3.57%
jan 1, 1991
855.657 mln
+26.008 mln
3.13%
jan 1, 1992
910.273 mln
+54.616 mln
6.38%
jan 1, 1993
1.22 bln
+309.493 mln
34.0%
jan 1, 1994
1.423 bln
+202.861 mln
16.63%
jan 1, 1995
1.365 bln
-57.217 mln
-4.02%
jan 1, 1996
1.537 bln
+171.651 mln
12.57%
jan 1, 1997
1.371 bln
-166.461 mln
-10.83%
jan 1, 1998
1.501 bln
+130.1 mln
9.49%
jan 1, 1999
1.467 bln
-33.8 mln
-2.25%
jan 1, 2000
1.438 bln
-28.7 mln
-1.96%
jan 1, 2001
1.451 bln
+13.0 mln
0.9%
jan 1, 2002
1.532 bln
+80.66 mln
5.56%
jan 1, 2003
1.602 bln
+70.221 mln
4.58%
jan 1, 2004
1.672 bln
+70.221 mln
4.38%
jan 1, 2005
1.826 bln
+153.446 mln
9.18%
jan 1, 2006
2.257 bln
+431.73 mln
23.65%
jan 1, 2007
2.788 bln
+530.559 mln
23.5%
jan 1, 2008
3.67 bln
+881.664 mln
31.62%
jan 1, 2009
5.181 bln
+1.511 bln
41.18%
jan 1, 2010
5.316 bln
+135.241 mln
2.61%
jan 1, 2011
5.704 bln
+387.516 mln
7.29%
jan 1, 2012
7.215 bln
+1.511 bln
26.49%
jan 1, 2013
8.087 bln
+872.042 mln
12.09%
jan 1, 2014
9.104 bln
+1.018 bln
12.59%
jan 1, 2015
10.301 bln
+1.196 bln
13.14%
jan 1, 2016
10.991 bln
+690.065 mln
6.7%
Ranking of countries by current statistics by years


Comments: