29
/
en
AIzaSyAYiBZKx7MnpbEhh9jyipgxe19OcubqV5w
April 1, 2024
172089
Kuwait
KWT
true
2
1
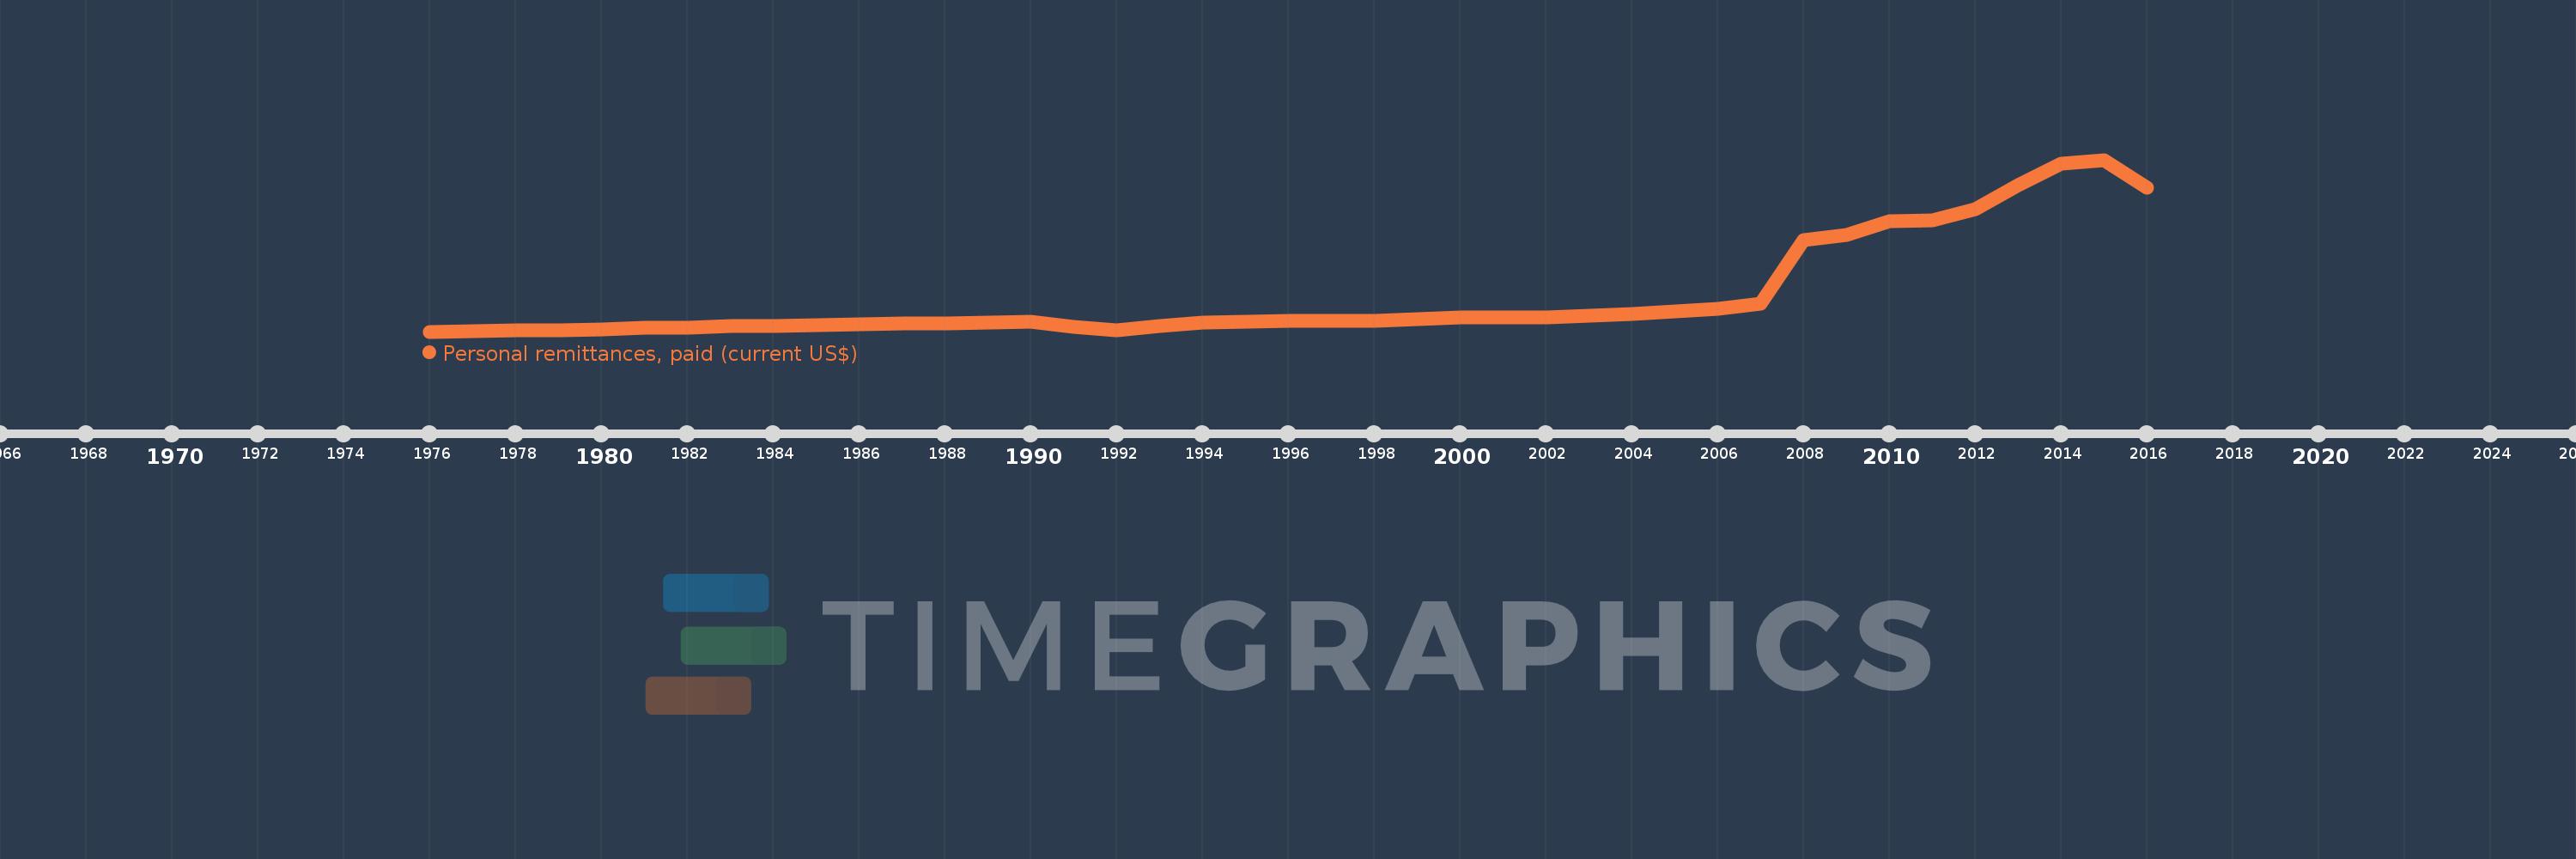
Personal remittances, paid (current US$)
2016,2015,2014,2013,2012,2011,2010,2009,2008,2007,2006,2005,2004,2003,2002,2001,2000,1999,1998,1997,1996,1995,1994,1993,1992,1991,1990,1989,1988,1987,1986,1985,1984,1983,1982,1981,1980,1979,1978,1977,1976
This statistics in other country:
AfghanistanAlbaniaAlgeriaAngolaAntigua and BarbudaArab WorldArgentinaArmeniaArubaAustraliaAustriaAzerbaijanBahamas, TheBahrainBangladeshBarbadosBelarusBelgiumBelizeBeninBermudaBhutanBoliviaBosnia and HerzegovinaBotswanaBrazilBrunei DarussalamBulgariaBurkina FasoBurundiCabo VerdeCambodiaCameroonCanadaCaribbean small statesCentral African RepublicCentral Europe and the BalticsChadChileChinaColombiaComorosCongo, Dem. Rep.Congo, Rep.Costa RicaCote d'IvoireCroatiaCuracaoCyprusCzech RepublicDenmarkDjiboutiDominicaDominican RepublicEarly-demographic dividendEast Asia & PacificEast Asia & Pacific (excluding high income)East Asia & Pacific (IDA & IBRD countries)EcuadorEgypt, Arab Rep.El SalvadorEquatorial GuineaEritreaEstoniaEthiopiaEuro areaEurope & Central AsiaEurope & Central Asia (excluding high income)Europe & Central Asia (IDA & IBRD countries)European UnionFaroe IslandsFijiFinlandFragile and conflict affected situationsFranceFrench PolynesiaGabonGambia, TheGeorgiaGermanyGhanaGreeceGrenadaGuatemalaGuineaGuinea-BissauGuyanaHaitiHeavily indebted poor countries (HIPC)High incomeHondurasHong Kong SAR, ChinaHungaryIBRD onlyIcelandIDA & IBRD totalIDA blendIDA onlyIDA totalIndiaIndonesiaIraqIrelandIsraelItalyJamaicaJapanJordanKazakhstanKenyaKiribatiKorea, Rep.KosovoKuwaitKyrgyz RepublicLao PDRLate-demographic dividendLatin America & Caribbean Latin America & Caribbean (excluding high income)Latin America & the Caribbean (IDA & IBRD countries)LatviaLeast developed countries: UN classificationLebanonLesothoLiberiaLibyaLithuaniaLow & middle incomeLow incomeLower middle incomeLuxembourgMacao SAR, ChinaMacedonia, FYRMadagascarMalawiMalaysiaMaldivesMaliMaltaMarshall IslandsMauritaniaMauritiusMexicoMicronesia, Fed. Sts.Middle East & North AfricaMiddle East & North Africa (excluding high income)Middle East & North Africa (IDA & IBRD countries)Middle incomeMoldovaMongoliaMontenegroMoroccoMozambiqueMyanmarNamibiaNepalNetherlandsNew CaledoniaNew ZealandNicaraguaNigerNigeriaNorth AmericaNorwayOECD membersOmanOther small statesPacific island small statesPakistanPalauPanamaPapua New GuineaParaguayPeruPhilippinesPolandPortugalPost-demographic dividendPre-demographic dividendQatarRomaniaRussian FederationRwandaSamoaSao Tome and PrincipeSaudi ArabiaSenegalSerbiaSeychellesSierra LeoneSint Maarten (Dutch part)Slovak RepublicSloveniaSmall statesSolomon IslandsSomaliaSouth AfricaSouth AsiaSouth Asia (IDA & IBRD)South SudanSpainSri LankaSt. Kitts and NevisSt. LuciaSt. Vincent and the GrenadinesSub-Saharan Africa Sub-Saharan Africa (excluding high income)Sub-Saharan Africa (IDA & IBRD countries)SudanSurinameSwazilandSwedenSwitzerlandSyrian Arab RepublicTajikistanTanzaniaThailandTimor-LesteTogoTongaTrinidad and TobagoTunisiaTurkeyTurkmenistanTuvaluUgandaUkraineUnited KingdomUnited StatesUpper middle incomeUruguayVanuatuVenezuela, RBVietnamWest Bank and GazaWorldYemen, Rep.ZambiaZimbabwe Timeline:
This timeline shows a graph from 1976 to 2016 of Kuwait. No data until 1975. Number of actual observations by date: 41.
Source name:
World Development Indicators
Source organization:
World Bank staff estimates based on IMF balance of payments data.
Categories, topics:
Economy & Growth, Financial Sector
Last updated:
apr 23, 2017
Indicators value changes by year
Minimum:
275.831 mln
jan 1, 1976
Maximum:
18.128 bln
jan 1, 2015
At the date of observation
Value
Absolute change
Change from previous value
jan 1, 1976
275.831 mln
+275.831 mln
0.0%
jan 1, 1977
314.651 mln
+38.82 mln
14.07%
jan 1, 1978
369.897 mln
+55.246 mln
17.56%
jan 1, 1979
432.644 mln
+62.747 mln
16.96%
jan 1, 1980
531.903 mln
+99.259 mln
22.94%
jan 1, 1981
691.831 mln
+159.927 mln
30.07%
jan 1, 1982
688.702 mln
-3.129 mln
-0.45%
jan 1, 1983
875.271 mln
+186.569 mln
27.09%
jan 1, 1984
864.563 mln
-10.707 mln
-1.22%
jan 1, 1985
962.636 mln
+98.073 mln
11.34%
jan 1, 1986
1.044 bln
+81.409 mln
8.46%
jan 1, 1987
1.084 bln
+39.939 mln
3.83%
jan 1, 1988
1.102 bln
+17.704 mln
1.63%
jan 1, 1989
1.179 bln
+77.4 mln
7.03%
jan 1, 1990
1.283 bln
+104.188 mln
8.84%
jan 1, 1991
769.617 mln
-513.658 mln
-40.03%
jan 1, 1992
425.654 mln
-343.964 mln
-44.69%
jan 1, 1993
828.722 mln
+403.068 mln
94.69%
jan 1, 1994
1.229 bln
+400.412 mln
48.32%
jan 1, 1995
1.331 bln
+101.414 mln
8.25%
jan 1, 1996
1.354 bln
+23.124 mln
1.74%
jan 1, 1997
1.376 bln
+22.375 mln
1.65%
jan 1, 1998
1.375 bln
-1.391 mln
-0.1%
jan 1, 1999
1.611 bln
+236.472 mln
17.2%
jan 1, 2000
1.731 bln
+120.064 mln
7.45%
jan 1, 2001
1.734 bln
+3.111 mln
0.18%
jan 1, 2002
1.785 bln
+50.61 mln
2.92%
jan 1, 2003
1.926 bln
+140.63 mln
7.88%
jan 1, 2004
2.144 bln
+218.334 mln
11.34%
jan 1, 2005
2.404 bln
+260.602 mln
12.16%
jan 1, 2006
2.648 bln
+243.124 mln
10.11%
jan 1, 2007
3.183 bln
+535.635 mln
20.23%
jan 1, 2008
9.764 bln
+6.581 bln
206.72%
jan 1, 2009
10.323 bln
+558.8 mln
5.72%
jan 1, 2010
11.749 bln
+1.427 bln
13.82%
jan 1, 2011
11.864 bln
+114.791 mln
0.98%
jan 1, 2012
13.012 bln
+1.148 bln
9.68%
jan 1, 2013
15.459 bln
+2.447 bln
18.81%
jan 1, 2014
17.711 bln
+2.252 bln
14.57%
jan 1, 2015
18.128 bln
+416.996 mln
2.35%
jan 1, 2016
15.203 bln
-2.926 bln
-16.14%
Ranking of countries by current statistics by years


Comments: