29
/
en
AIzaSyAYiBZKx7MnpbEhh9jyipgxe19OcubqV5w
April 1, 2024
41806
Latin America & Caribbean
LCN
false
2
1
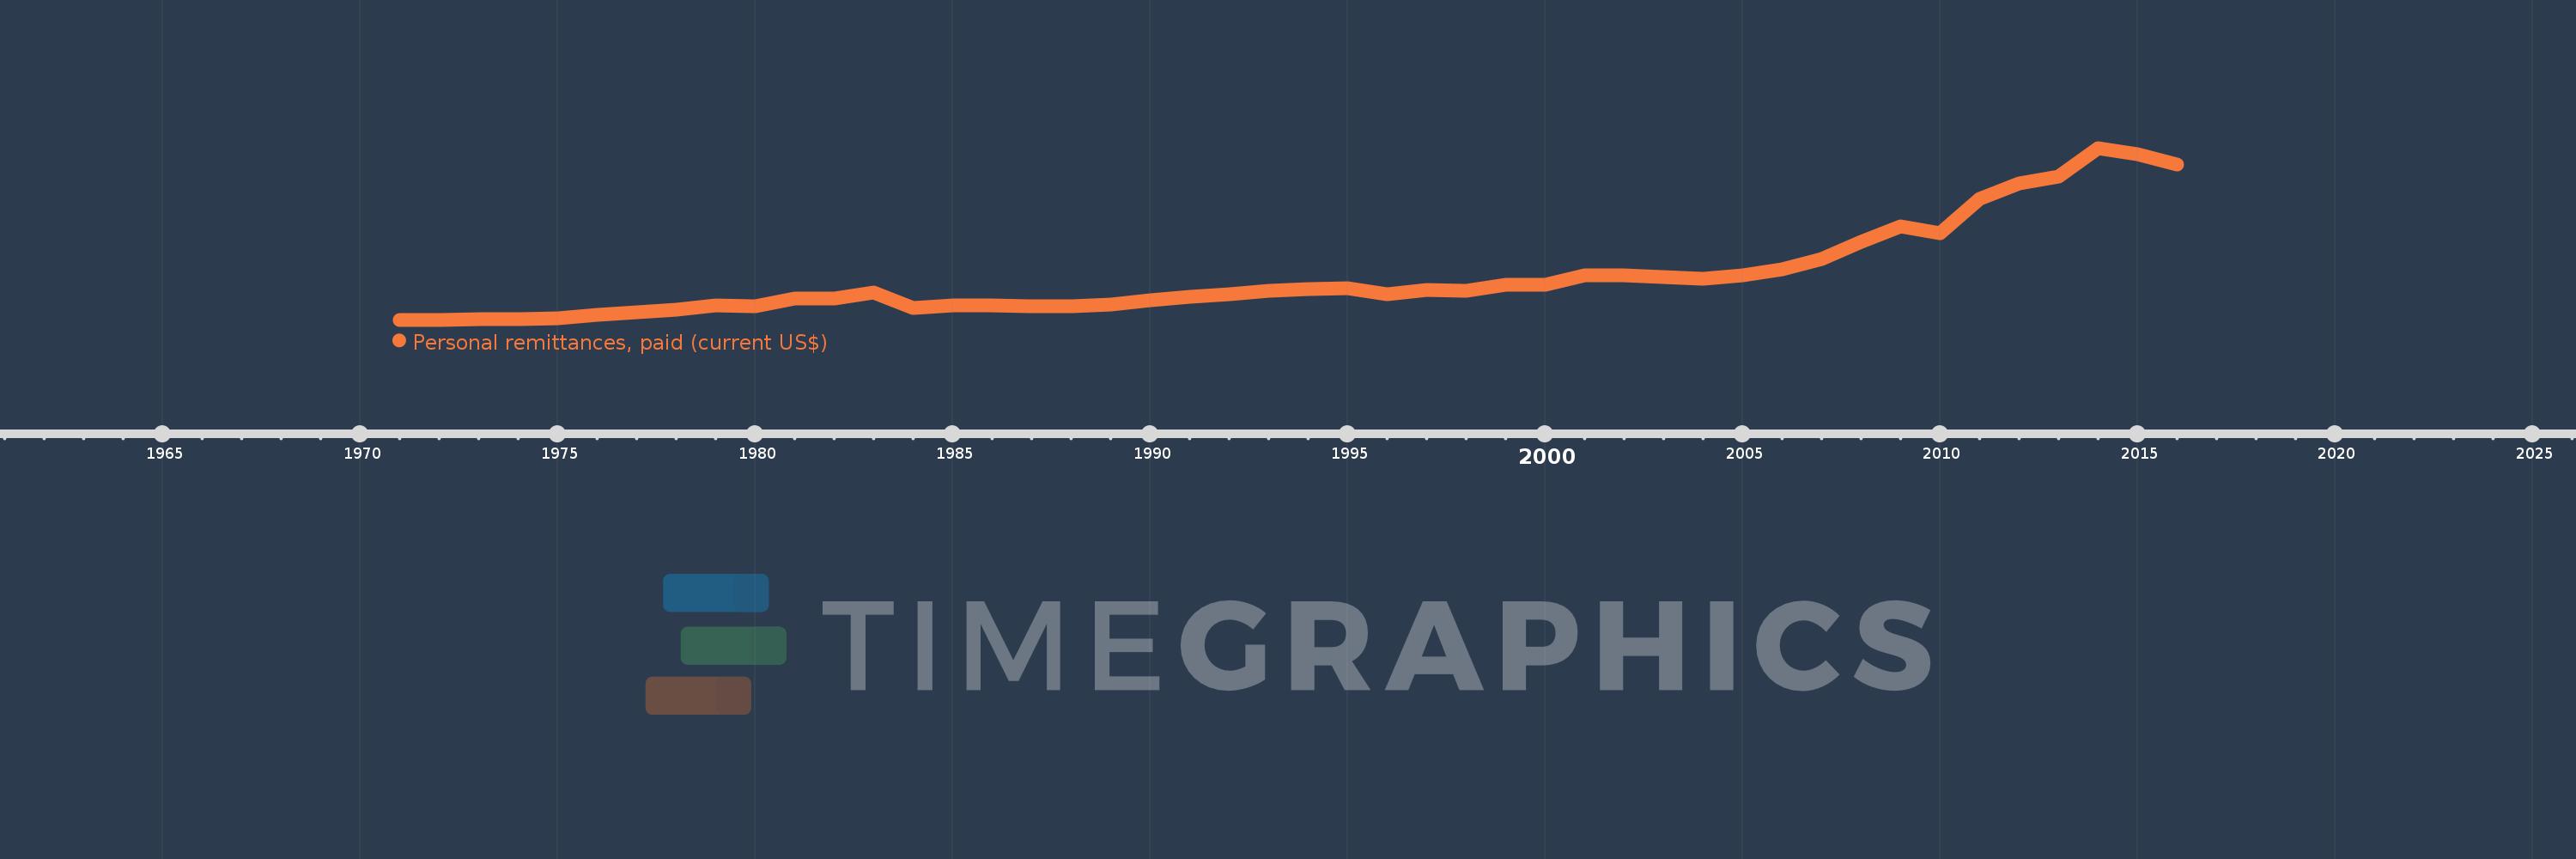
Personal remittances, paid (current US$)
2016,2015,2014,2013,2012,2011,2010,2009,2008,2007,2006,2005,2004,2003,2002,2001,2000,1999,1998,1997,1996,1995,1994,1993,1992,1991,1990,1989,1988,1987,1986,1985,1984,1983,1982,1981,1980,1979,1978,1977,1976,1975,1974,1973,1972,1971
This statistics in other country:
AfghanistanAlbaniaAlgeriaAngolaAntigua and BarbudaArab WorldArgentinaArmeniaArubaAustraliaAustriaAzerbaijanBahamas, TheBahrainBangladeshBarbadosBelarusBelgiumBelizeBeninBermudaBhutanBoliviaBosnia and HerzegovinaBotswanaBrazilBrunei DarussalamBulgariaBurkina FasoBurundiCabo VerdeCambodiaCameroonCanadaCaribbean small statesCentral African RepublicCentral Europe and the BalticsChadChileChinaColombiaComorosCongo, Dem. Rep.Congo, Rep.Costa RicaCote d'IvoireCroatiaCuracaoCyprusCzech RepublicDenmarkDjiboutiDominicaDominican RepublicEarly-demographic dividendEast Asia & PacificEast Asia & Pacific (excluding high income)East Asia & Pacific (IDA & IBRD countries)EcuadorEgypt, Arab Rep.El SalvadorEquatorial GuineaEritreaEstoniaEthiopiaEuro areaEurope & Central AsiaEurope & Central Asia (excluding high income)Europe & Central Asia (IDA & IBRD countries)European UnionFaroe IslandsFijiFinlandFragile and conflict affected situationsFranceFrench PolynesiaGabonGambia, TheGeorgiaGermanyGhanaGreeceGrenadaGuatemalaGuineaGuinea-BissauGuyanaHaitiHeavily indebted poor countries (HIPC)High incomeHondurasHong Kong SAR, ChinaHungaryIBRD onlyIcelandIDA & IBRD totalIDA blendIDA onlyIDA totalIndiaIndonesiaIraqIrelandIsraelItalyJamaicaJapanJordanKazakhstanKenyaKiribatiKorea, Rep.KosovoKuwaitKyrgyz RepublicLao PDRLate-demographic dividendLatin America & Caribbean Latin America & Caribbean (excluding high income)Latin America & the Caribbean (IDA & IBRD countries)LatviaLeast developed countries: UN classificationLebanonLesothoLiberiaLibyaLithuaniaLow & middle incomeLow incomeLower middle incomeLuxembourgMacao SAR, ChinaMacedonia, FYRMadagascarMalawiMalaysiaMaldivesMaliMaltaMarshall IslandsMauritaniaMauritiusMexicoMicronesia, Fed. Sts.Middle East & North AfricaMiddle East & North Africa (excluding high income)Middle East & North Africa (IDA & IBRD countries)Middle incomeMoldovaMongoliaMontenegroMoroccoMozambiqueMyanmarNamibiaNepalNetherlandsNew CaledoniaNew ZealandNicaraguaNigerNigeriaNorth AmericaNorwayOECD membersOmanOther small statesPacific island small statesPakistanPalauPanamaPapua New GuineaParaguayPeruPhilippinesPolandPortugalPost-demographic dividendPre-demographic dividendQatarRomaniaRussian FederationRwandaSamoaSao Tome and PrincipeSaudi ArabiaSenegalSerbiaSeychellesSierra LeoneSint Maarten (Dutch part)Slovak RepublicSloveniaSmall statesSolomon IslandsSomaliaSouth AfricaSouth AsiaSouth Asia (IDA & IBRD)South SudanSpainSri LankaSt. Kitts and NevisSt. LuciaSt. Vincent and the GrenadinesSub-Saharan Africa Sub-Saharan Africa (excluding high income)Sub-Saharan Africa (IDA & IBRD countries)SudanSurinameSwazilandSwedenSwitzerlandSyrian Arab RepublicTajikistanTanzaniaThailandTimor-LesteTogoTongaTrinidad and TobagoTunisiaTurkeyTurkmenistanTuvaluUgandaUkraineUnited KingdomUnited StatesUpper middle incomeUruguayVanuatuVenezuela, RBVietnamWest Bank and GazaWorldYemen, Rep.ZambiaZimbabwe Timeline:
This timeline shows a graph from 1971 to 2016 of Latin America & Caribbean . No data until 1970. Number of actual observations by date: 46.
Source name:
World Development Indicators
Source organization:
World Bank staff estimates based on IMF balance of payments data.
Categories, topics:
Economy & Growth, Financial Sector
Last updated:
apr 23, 2017
Indicators value changes by year
Minimum:
98.793 mln
jan 1, 1972
Maximum:
7.754 bln
jan 1, 2014
At the date of observation
Value
Absolute change
Change from previous value
jan 1, 1971
100.55 mln
+100.55 mln
0.0%
jan 1, 1972
98.793 mln
-1.757 mln
-1.75%
jan 1, 1973
108.896 mln
+10.103 mln
10.23%
jan 1, 1974
129.062 mln
+20.166 mln
18.52%
jan 1, 1975
161.27 mln
+32.208 mln
24.96%
jan 1, 1976
320.527 mln
+159.257 mln
98.75%
jan 1, 1977
445.314 mln
+124.787 mln
38.93%
jan 1, 1978
556.3 mln
+110.987 mln
24.92%
jan 1, 1979
750.618 mln
+194.318 mln
34.93%
jan 1, 1980
697.808 mln
-52.81 mln
-7.04%
jan 1, 1981
1.042 bln
+344.514 mln
49.37%
jan 1, 1982
1.046 bln
+3.986 mln
0.38%
jan 1, 1983
1.297 bln
+250.768 mln
23.97%
jan 1, 1984
629.694 mln
-667.383 mln
-51.45%
jan 1, 1985
721.648 mln
+91.954 mln
14.6%
jan 1, 1986
752.278 mln
+30.63 mln
4.24%
jan 1, 1987
698.052 mln
-54.226 mln
-7.21%
jan 1, 1988
716.891 mln
+18.84 mln
2.7%
jan 1, 1989
781.05 mln
+64.159 mln
8.95%
jan 1, 1990
964.538 mln
+183.488 mln
23.49%
jan 1, 1991
1.122 bln
+156.972 mln
16.27%
jan 1, 1992
1.226 bln
+104.713 mln
9.34%
jan 1, 1993
1.391 bln
+165.105 mln
13.46%
jan 1, 1994
1.48 bln
+88.702 mln
6.38%
jan 1, 1995
1.513 bln
+32.716 mln
2.21%
jan 1, 1996
1.22 bln
-292.481 mln
-19.33%
jan 1, 1997
1.441 bln
+221.075 mln
18.12%
jan 1, 1998
1.406 bln
-35.025 mln
-2.43%
jan 1, 1999
1.651 bln
+244.423 mln
17.38%
jan 1, 2000
1.663 bln
+12.741 mln
0.77%
jan 1, 2001
2.093 bln
+429.361 mln
25.81%
jan 1, 2002
2.091 bln
-1.474 mln
-0.07%
jan 1, 2003
1.995 bln
-96.484 mln
-4.61%
jan 1, 2004
1.93 bln
-65.056 mln
-3.26%
jan 1, 2005
2.094 bln
+164.197 mln
8.51%
jan 1, 2006
2.328 bln
+234.02 mln
11.18%
jan 1, 2007
2.8 bln
+472.388 mln
20.29%
jan 1, 2008
3.556 bln
+755.596 mln
26.98%
jan 1, 2009
4.25 bln
+694.136 mln
19.52%
jan 1, 2010
3.961 bln
-288.93 mln
-6.8%
jan 1, 2011
5.486 bln
+1.525 bln
38.5%
jan 1, 2012
6.166 bln
+679.493 mln
12.39%
jan 1, 2013
6.469 bln
+303.23 mln
4.92%
jan 1, 2014
7.754 bln
+1.285 bln
19.86%
jan 1, 2015
7.465 bln
-288.405 mln
-3.72%
jan 1, 2016
7.026 bln
-439.03 mln
-5.88%
Ranking of countries by current statistics by years


Comments: