29
/
en
AIzaSyAYiBZKx7MnpbEhh9jyipgxe19OcubqV5w
April 1, 2024
55795
Pre-demographic dividend
PRE
false
2
1
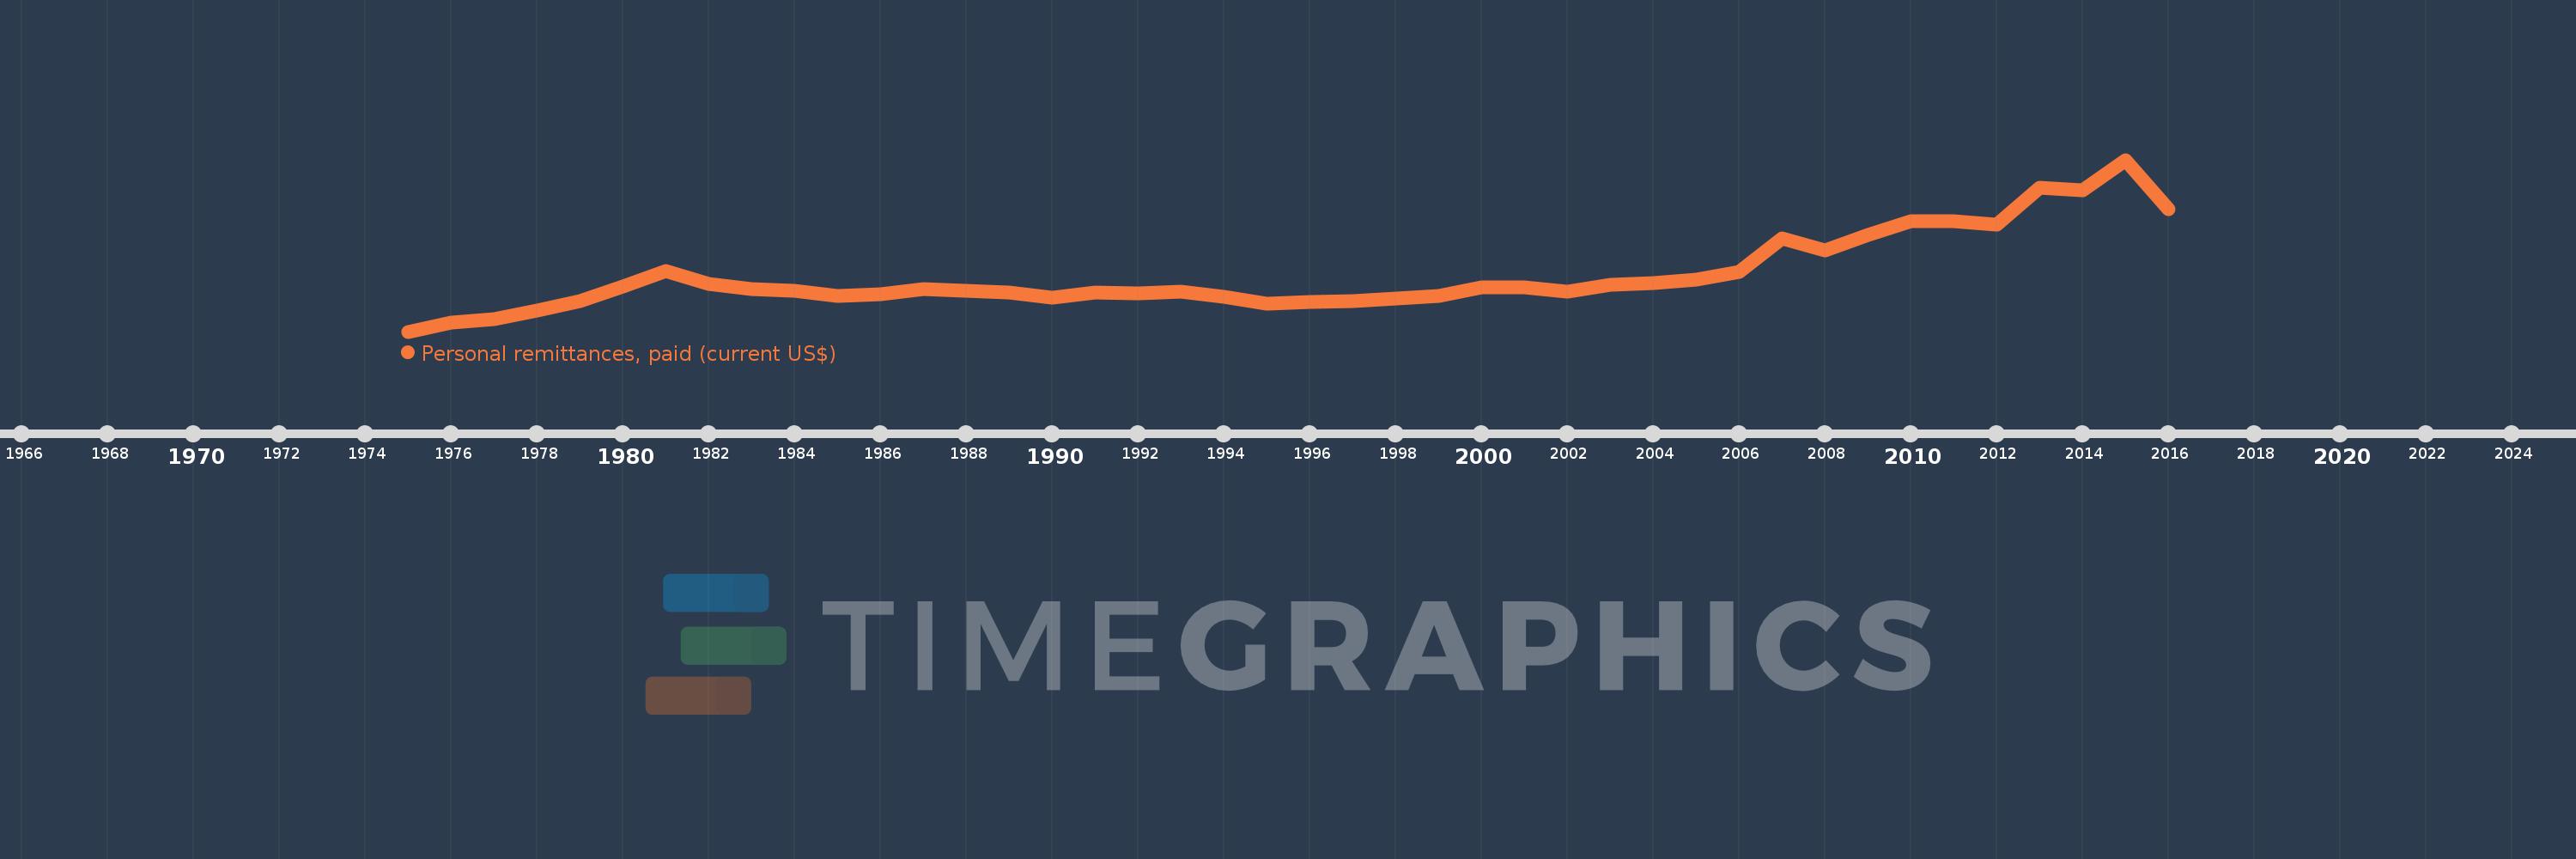
Personal remittances, paid (current US$)
2016,2015,2014,2013,2012,2011,2010,2009,2008,2007,2006,2005,2004,2003,2002,2001,2000,1999,1998,1997,1996,1995,1994,1993,1992,1991,1990,1989,1988,1987,1986,1985,1984,1983,1982,1981,1980,1979,1978,1977,1976,1975
This statistics in other country:
AfghanistanAlbaniaAlgeriaAngolaAntigua and BarbudaArab WorldArgentinaArmeniaArubaAustraliaAustriaAzerbaijanBahamas, TheBahrainBangladeshBarbadosBelarusBelgiumBelizeBeninBermudaBhutanBoliviaBosnia and HerzegovinaBotswanaBrazilBrunei DarussalamBulgariaBurkina FasoBurundiCabo VerdeCambodiaCameroonCanadaCaribbean small statesCentral African RepublicCentral Europe and the BalticsChadChileChinaColombiaComorosCongo, Dem. Rep.Congo, Rep.Costa RicaCote d'IvoireCroatiaCuracaoCyprusCzech RepublicDenmarkDjiboutiDominicaDominican RepublicEarly-demographic dividendEast Asia & PacificEast Asia & Pacific (excluding high income)East Asia & Pacific (IDA & IBRD countries)EcuadorEgypt, Arab Rep.El SalvadorEquatorial GuineaEritreaEstoniaEthiopiaEuro areaEurope & Central AsiaEurope & Central Asia (excluding high income)Europe & Central Asia (IDA & IBRD countries)European UnionFaroe IslandsFijiFinlandFragile and conflict affected situationsFranceFrench PolynesiaGabonGambia, TheGeorgiaGermanyGhanaGreeceGrenadaGuatemalaGuineaGuinea-BissauGuyanaHaitiHeavily indebted poor countries (HIPC)High incomeHondurasHong Kong SAR, ChinaHungaryIBRD onlyIcelandIDA & IBRD totalIDA blendIDA onlyIDA totalIndiaIndonesiaIraqIrelandIsraelItalyJamaicaJapanJordanKazakhstanKenyaKiribatiKorea, Rep.KosovoKuwaitKyrgyz RepublicLao PDRLate-demographic dividendLatin America & Caribbean Latin America & Caribbean (excluding high income)Latin America & the Caribbean (IDA & IBRD countries)LatviaLeast developed countries: UN classificationLebanonLesothoLiberiaLibyaLithuaniaLow & middle incomeLow incomeLower middle incomeLuxembourgMacao SAR, ChinaMacedonia, FYRMadagascarMalawiMalaysiaMaldivesMaliMaltaMarshall IslandsMauritaniaMauritiusMexicoMicronesia, Fed. Sts.Middle East & North AfricaMiddle East & North Africa (excluding high income)Middle East & North Africa (IDA & IBRD countries)Middle incomeMoldovaMongoliaMontenegroMoroccoMozambiqueMyanmarNamibiaNepalNetherlandsNew CaledoniaNew ZealandNicaraguaNigerNigeriaNorth AmericaNorwayOECD membersOmanOther small statesPacific island small statesPakistanPalauPanamaPapua New GuineaParaguayPeruPhilippinesPolandPortugalPost-demographic dividendPre-demographic dividendQatarRomaniaRussian FederationRwandaSamoaSao Tome and PrincipeSaudi ArabiaSenegalSerbiaSeychellesSierra LeoneSint Maarten (Dutch part)Slovak RepublicSloveniaSmall statesSolomon IslandsSomaliaSouth AfricaSouth AsiaSouth Asia (IDA & IBRD)South SudanSpainSri LankaSt. Kitts and NevisSt. LuciaSt. Vincent and the GrenadinesSub-Saharan Africa Sub-Saharan Africa (excluding high income)Sub-Saharan Africa (IDA & IBRD countries)SudanSurinameSwazilandSwedenSwitzerlandSyrian Arab RepublicTajikistanTanzaniaThailandTimor-LesteTogoTongaTrinidad and TobagoTunisiaTurkeyTurkmenistanTuvaluUgandaUkraineUnited KingdomUnited StatesUpper middle incomeUruguayVanuatuVenezuela, RBVietnamWest Bank and GazaWorldYemen, Rep.ZambiaZimbabwe Timeline:
This timeline shows a graph from 1975 to 2016 of Pre-demographic dividend. No data until 1974. Number of actual observations by date: 42.
Source name:
World Development Indicators
Source organization:
World Bank staff estimates based on IMF balance of payments data.
Categories, topics:
Economy & Growth, Financial Sector
Last updated:
apr 23, 2017
Indicators value changes by year
Minimum:
86.887 mln
jan 1, 1975
Maximum:
5.497 bln
jan 1, 2015
At the date of observation
Value
Absolute change
Change from previous value
jan 1, 1975
86.887 mln
+86.887 mln
0.0%
jan 1, 1976
359.711 mln
+272.825 mln
314.0%
jan 1, 1977
470.566 mln
+110.855 mln
30.82%
jan 1, 1978
755.399 mln
+284.833 mln
60.53%
jan 1, 1979
1.059 bln
+303.277 mln
40.15%
jan 1, 1980
1.494 bln
+435.692 mln
41.15%
jan 1, 1981
1.982 bln
+487.565 mln
32.63%
jan 1, 1982
1.58 bln
-401.705 mln
-20.27%
jan 1, 1983
1.423 bln
-157.325 mln
-9.96%
jan 1, 1984
1.376 bln
-46.602 mln
-3.28%
jan 1, 1985
1.204 bln
-172.036 mln
-12.5%
jan 1, 1986
1.271 bln
+67.071 mln
5.57%
jan 1, 1987
1.433 bln
+162.049 mln
12.75%
jan 1, 1988
1.367 bln
-66.494 mln
-4.64%
jan 1, 1989
1.329 bln
-37.982 mln
-2.78%
jan 1, 1990
1.162 bln
-166.931 mln
-12.56%
jan 1, 1991
1.321 bln
+158.94 mln
13.68%
jan 1, 1992
1.301 bln
-19.558 mln
-1.48%
jan 1, 1993
1.35 bln
+48.636 mln
3.74%
jan 1, 1994
1.193 bln
-156.735 mln
-11.61%
jan 1, 1995
963.639 mln
-229.621 mln
-19.24%
jan 1, 1996
1.029 bln
+65.505 mln
6.8%
jan 1, 1997
1.06 bln
+31.336 mln
3.04%
jan 1, 1998
1.117 bln
+56.458 mln
5.32%
jan 1, 1999
1.201 bln
+83.928 mln
7.51%
jan 1, 2000
1.485 bln
+284.093 mln
23.66%
jan 1, 2001
1.483 bln
-2.318 mln
-0.16%
jan 1, 2002
1.355 bln
-128.02 mln
-8.63%
jan 1, 2003
1.554 bln
+199.082 mln
14.7%
jan 1, 2004
1.602 bln
+48.342 mln
3.11%
jan 1, 2005
1.719 bln
+116.575 mln
7.28%
jan 1, 2006
1.968 bln
+249.079 mln
14.49%
jan 1, 2007
3.02 bln
+1.052 bln
53.48%
jan 1, 2008
2.64 bln
-379.736 mln
-12.57%
jan 1, 2009
3.12 bln
+480.048 mln
18.18%
jan 1, 2010
3.556 bln
+435.601 mln
13.96%
jan 1, 2011
3.564 bln
+7.548 mln
0.21%
jan 1, 2012
3.445 bln
-118.618 mln
-3.33%
jan 1, 2013
4.607 bln
+1.162 bln
33.73%
jan 1, 2014
4.527 bln
-79.597 mln
-1.73%
jan 1, 2015
5.497 bln
+969.765 mln
21.42%
jan 1, 2016
3.933 bln
-1.564 bln
-28.45%
Ranking of countries by current statistics by years


Comments: