29
/
en
AIzaSyAYiBZKx7MnpbEhh9jyipgxe19OcubqV5w
April 1, 2024
43778
Latin America & the Caribbean (IDA & IBRD countries)
TLA
false
2
1
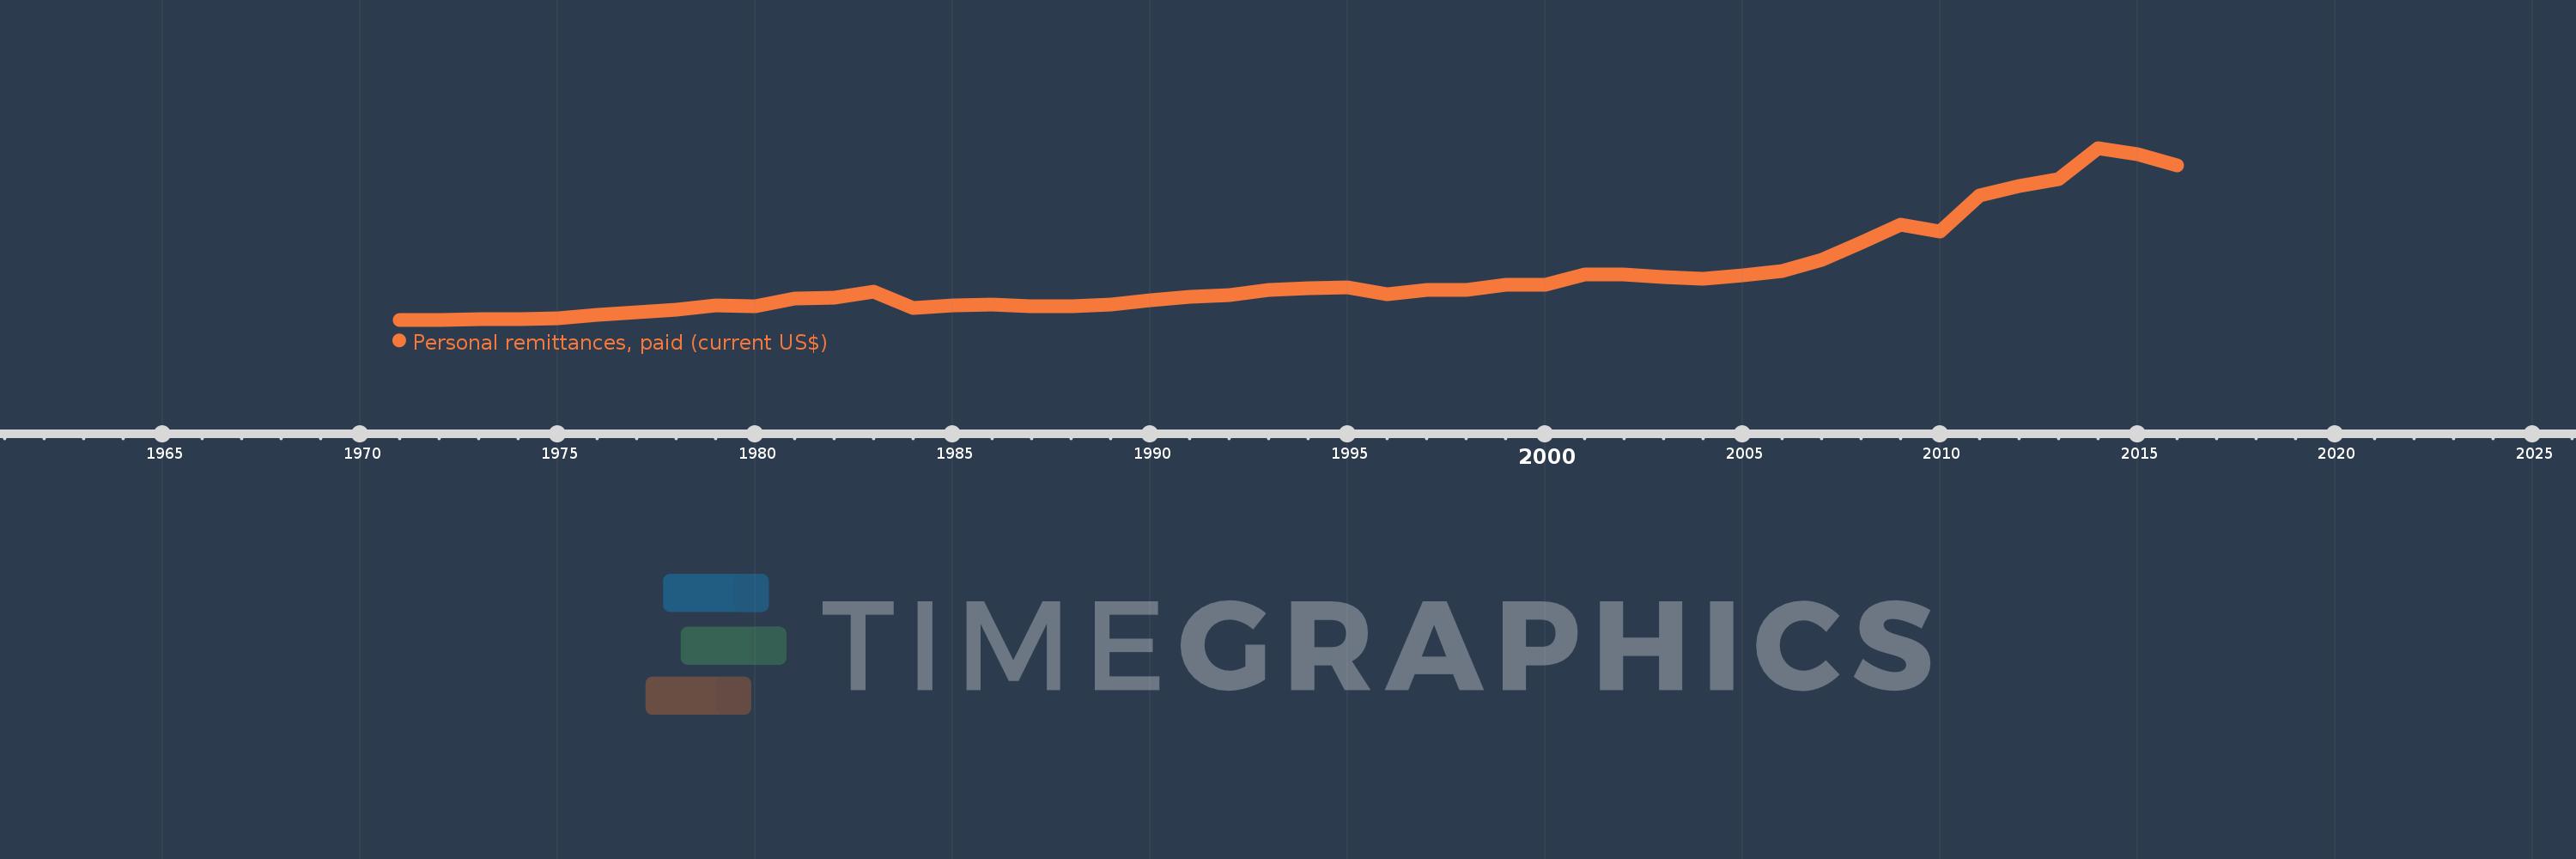
Personal remittances, paid (current US$)
2016,2015,2014,2013,2012,2011,2010,2009,2008,2007,2006,2005,2004,2003,2002,2001,2000,1999,1998,1997,1996,1995,1994,1993,1992,1991,1990,1989,1988,1987,1986,1985,1984,1983,1982,1981,1980,1979,1978,1977,1976,1975,1974,1973,1972,1971
This statistics in other country:
AfghanistanAlbaniaAlgeriaAngolaAntigua and BarbudaArab WorldArgentinaArmeniaArubaAustraliaAustriaAzerbaijanBahamas, TheBahrainBangladeshBarbadosBelarusBelgiumBelizeBeninBermudaBhutanBoliviaBosnia and HerzegovinaBotswanaBrazilBrunei DarussalamBulgariaBurkina FasoBurundiCabo VerdeCambodiaCameroonCanadaCaribbean small statesCentral African RepublicCentral Europe and the BalticsChadChileChinaColombiaComorosCongo, Dem. Rep.Congo, Rep.Costa RicaCote d'IvoireCroatiaCuracaoCyprusCzech RepublicDenmarkDjiboutiDominicaDominican RepublicEarly-demographic dividendEast Asia & PacificEast Asia & Pacific (excluding high income)East Asia & Pacific (IDA & IBRD countries)EcuadorEgypt, Arab Rep.El SalvadorEquatorial GuineaEritreaEstoniaEthiopiaEuro areaEurope & Central AsiaEurope & Central Asia (excluding high income)Europe & Central Asia (IDA & IBRD countries)European UnionFaroe IslandsFijiFinlandFragile and conflict affected situationsFranceFrench PolynesiaGabonGambia, TheGeorgiaGermanyGhanaGreeceGrenadaGuatemalaGuineaGuinea-BissauGuyanaHaitiHeavily indebted poor countries (HIPC)High incomeHondurasHong Kong SAR, ChinaHungaryIBRD onlyIcelandIDA & IBRD totalIDA blendIDA onlyIDA totalIndiaIndonesiaIraqIrelandIsraelItalyJamaicaJapanJordanKazakhstanKenyaKiribatiKorea, Rep.KosovoKuwaitKyrgyz RepublicLao PDRLate-demographic dividendLatin America & Caribbean Latin America & Caribbean (excluding high income)Latin America & the Caribbean (IDA & IBRD countries)LatviaLeast developed countries: UN classificationLebanonLesothoLiberiaLibyaLithuaniaLow & middle incomeLow incomeLower middle incomeLuxembourgMacao SAR, ChinaMacedonia, FYRMadagascarMalawiMalaysiaMaldivesMaliMaltaMarshall IslandsMauritaniaMauritiusMexicoMicronesia, Fed. Sts.Middle East & North AfricaMiddle East & North Africa (excluding high income)Middle East & North Africa (IDA & IBRD countries)Middle incomeMoldovaMongoliaMontenegroMoroccoMozambiqueMyanmarNamibiaNepalNetherlandsNew CaledoniaNew ZealandNicaraguaNigerNigeriaNorth AmericaNorwayOECD membersOmanOther small statesPacific island small statesPakistanPalauPanamaPapua New GuineaParaguayPeruPhilippinesPolandPortugalPost-demographic dividendPre-demographic dividendQatarRomaniaRussian FederationRwandaSamoaSao Tome and PrincipeSaudi ArabiaSenegalSerbiaSeychellesSierra LeoneSint Maarten (Dutch part)Slovak RepublicSloveniaSmall statesSolomon IslandsSomaliaSouth AfricaSouth AsiaSouth Asia (IDA & IBRD)South SudanSpainSri LankaSt. Kitts and NevisSt. LuciaSt. Vincent and the GrenadinesSub-Saharan Africa Sub-Saharan Africa (excluding high income)Sub-Saharan Africa (IDA & IBRD countries)SudanSurinameSwazilandSwedenSwitzerlandSyrian Arab RepublicTajikistanTanzaniaThailandTimor-LesteTogoTongaTrinidad and TobagoTunisiaTurkeyTurkmenistanTuvaluUgandaUkraineUnited KingdomUnited StatesUpper middle incomeUruguayVanuatuVenezuela, RBVietnamWest Bank and GazaWorldYemen, Rep.ZambiaZimbabwe Timeline:
This timeline shows a graph from 1971 to 2016 of Latin America & the Caribbean (IDA & IBRD countries). No data until 1970. Number of actual observations by date: 46.
Source name:
World Development Indicators
Source organization:
World Bank staff estimates based on IMF balance of payments data.
Categories, topics:
Economy & Growth, Financial Sector
Last updated:
apr 23, 2017
Indicators value changes by year
Minimum:
98.439 mln
jan 1, 1972
Maximum:
7.277 bln
jan 1, 2014
At the date of observation
Value
Absolute change
Change from previous value
jan 1, 1971
100.0 mln
+100.0 mln
0.0%
jan 1, 1972
98.439 mln
-1.561 mln
-1.56%
jan 1, 1973
108.48 mln
+10.041 mln
10.2%
jan 1, 1974
128.246 mln
+19.766 mln
18.22%
jan 1, 1975
160.832 mln
+32.586 mln
25.41%
jan 1, 1976
320.13 mln
+159.299 mln
99.05%
jan 1, 1977
418.714 mln
+98.583 mln
30.79%
jan 1, 1978
526.45 mln
+107.737 mln
25.73%
jan 1, 1979
711.068 mln
+184.618 mln
35.07%
jan 1, 1980
669.858 mln
-41.21 mln
-5.8%
jan 1, 1981
999.923 mln
+330.064 mln
49.27%
jan 1, 1982
1.015 bln
+15.086 mln
1.51%
jan 1, 1983
1.261 bln
+246.318 mln
24.27%
jan 1, 1984
602.494 mln
-658.833 mln
-52.23%
jan 1, 1985
688.398 mln
+85.904 mln
14.26%
jan 1, 1986
717.828 mln
+29.43 mln
4.28%
jan 1, 1987
665.052 mln
-52.776 mln
-7.35%
jan 1, 1988
672.891 mln
+7.84 mln
1.18%
jan 1, 1989
730.0 mln
+57.109 mln
8.49%
jan 1, 1990
917.838 mln
+187.838 mln
25.73%
jan 1, 1991
1.069 bln
+151.022 mln
16.45%
jan 1, 1992
1.143 bln
+74.284 mln
6.95%
jan 1, 1993
1.337 bln
+193.689 mln
16.94%
jan 1, 1994
1.427 bln
+89.852 mln
6.72%
jan 1, 1995
1.454 bln
+27.11 mln
1.9%
jan 1, 1996
1.152 bln
-301.728 mln
-20.75%
jan 1, 1997
1.355 bln
+203.39 mln
17.65%
jan 1, 1998
1.33 bln
-25.651 mln
-1.89%
jan 1, 1999
1.565 bln
+235.64 mln
17.72%
jan 1, 2000
1.551 bln
-14.924 mln
-0.95%
jan 1, 2001
1.974 bln
+423.255 mln
27.3%
jan 1, 2002
1.978 bln
+4.557 mln
0.23%
jan 1, 2003
1.871 bln
-107.218 mln
-5.42%
jan 1, 2004
1.798 bln
-73.391 mln
-3.92%
jan 1, 2005
1.955 bln
+157.585 mln
8.77%
jan 1, 2006
2.141 bln
+186.044 mln
9.51%
jan 1, 2007
2.592 bln
+451.145 mln
21.07%
jan 1, 2008
3.333 bln
+740.179 mln
28.55%
jan 1, 2009
4.07 bln
+736.899 mln
22.11%
jan 1, 2010
3.788 bln
-281.815 mln
-6.92%
jan 1, 2011
5.298 bln
+1.511 bln
39.88%
jan 1, 2012
5.687 bln
+388.642 mln
7.34%
jan 1, 2013
5.982 bln
+294.949 mln
5.19%
jan 1, 2014
7.277 bln
+1.295 bln
21.65%
jan 1, 2015
7.009 bln
-267.887 mln
-3.68%
jan 1, 2016
6.535 bln
-473.927 mln
-6.76%
Ranking of countries by current statistics by years


Comments: