29
/
en
AIzaSyAYiBZKx7MnpbEhh9jyipgxe19OcubqV5w
April 1, 2024
203388
Mozambique
MOZ
true
2
1
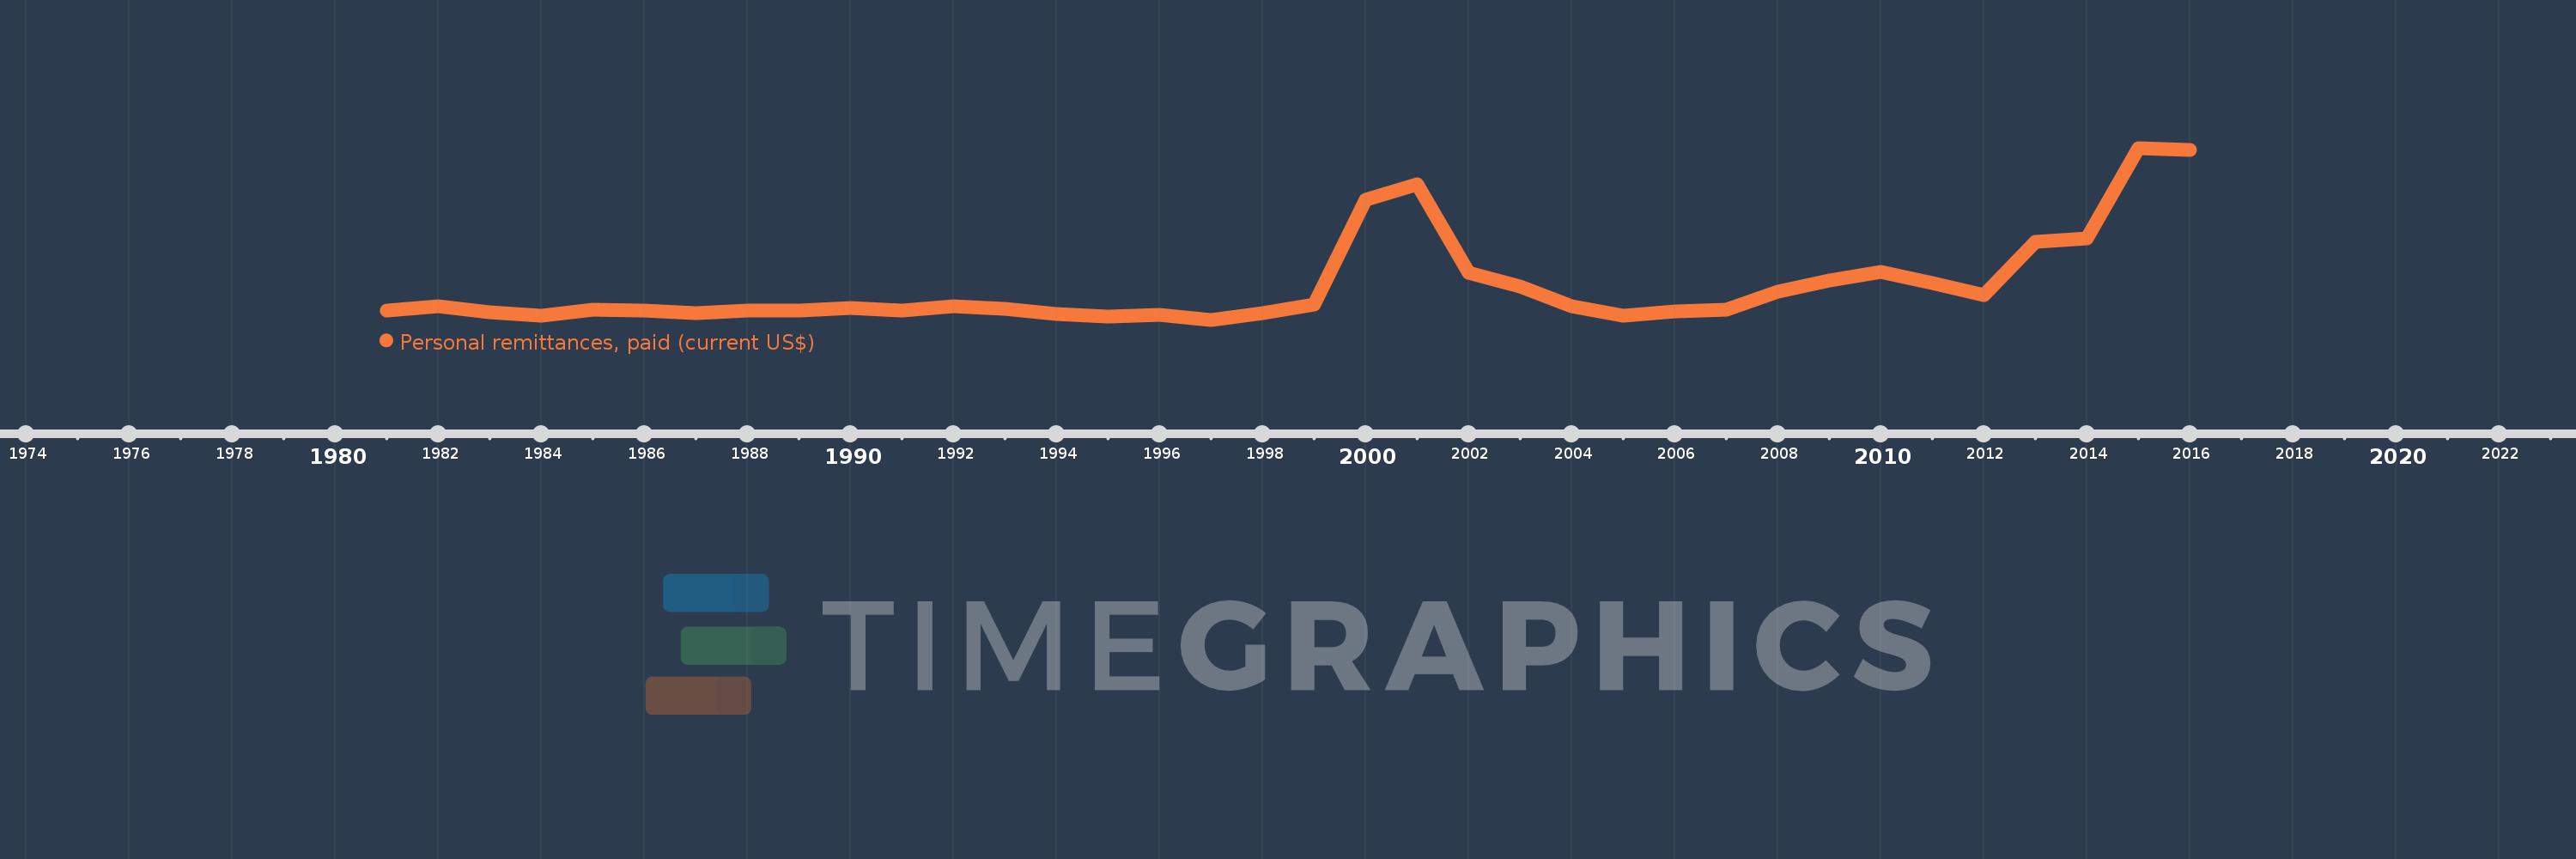
Personal remittances, paid (current US$)
2016,2015,2014,2013,2012,2011,2010,2009,2008,2007,2006,2005,2004,2003,2002,2001,2000,1999,1998,1997,1996,1995,1994,1993,1992,1991,1990,1989,1988,1987,1986,1985,1984,1983,1982,1981
This statistics in other country:
AfghanistanAlbaniaAlgeriaAngolaAntigua and BarbudaArab WorldArgentinaArmeniaArubaAustraliaAustriaAzerbaijanBahamas, TheBahrainBangladeshBarbadosBelarusBelgiumBelizeBeninBermudaBhutanBoliviaBosnia and HerzegovinaBotswanaBrazilBrunei DarussalamBulgariaBurkina FasoBurundiCabo VerdeCambodiaCameroonCanadaCaribbean small statesCentral African RepublicCentral Europe and the BalticsChadChileChinaColombiaComorosCongo, Dem. Rep.Congo, Rep.Costa RicaCote d'IvoireCroatiaCuracaoCyprusCzech RepublicDenmarkDjiboutiDominicaDominican RepublicEarly-demographic dividendEast Asia & PacificEast Asia & Pacific (excluding high income)East Asia & Pacific (IDA & IBRD countries)EcuadorEgypt, Arab Rep.El SalvadorEquatorial GuineaEritreaEstoniaEthiopiaEuro areaEurope & Central AsiaEurope & Central Asia (excluding high income)Europe & Central Asia (IDA & IBRD countries)European UnionFaroe IslandsFijiFinlandFragile and conflict affected situationsFranceFrench PolynesiaGabonGambia, TheGeorgiaGermanyGhanaGreeceGrenadaGuatemalaGuineaGuinea-BissauGuyanaHaitiHeavily indebted poor countries (HIPC)High incomeHondurasHong Kong SAR, ChinaHungaryIBRD onlyIcelandIDA & IBRD totalIDA blendIDA onlyIDA totalIndiaIndonesiaIraqIrelandIsraelItalyJamaicaJapanJordanKazakhstanKenyaKiribatiKorea, Rep.KosovoKuwaitKyrgyz RepublicLao PDRLate-demographic dividendLatin America & Caribbean Latin America & Caribbean (excluding high income)Latin America & the Caribbean (IDA & IBRD countries)LatviaLeast developed countries: UN classificationLebanonLesothoLiberiaLibyaLithuaniaLow & middle incomeLow incomeLower middle incomeLuxembourgMacao SAR, ChinaMacedonia, FYRMadagascarMalawiMalaysiaMaldivesMaliMaltaMarshall IslandsMauritaniaMauritiusMexicoMicronesia, Fed. Sts.Middle East & North AfricaMiddle East & North Africa (excluding high income)Middle East & North Africa (IDA & IBRD countries)Middle incomeMoldovaMongoliaMontenegroMoroccoMozambiqueMyanmarNamibiaNepalNetherlandsNew CaledoniaNew ZealandNicaraguaNigerNigeriaNorth AmericaNorwayOECD membersOmanOther small statesPacific island small statesPakistanPalauPanamaPapua New GuineaParaguayPeruPhilippinesPolandPortugalPost-demographic dividendPre-demographic dividendQatarRomaniaRussian FederationRwandaSamoaSao Tome and PrincipeSaudi ArabiaSenegalSerbiaSeychellesSierra LeoneSint Maarten (Dutch part)Slovak RepublicSloveniaSmall statesSolomon IslandsSomaliaSouth AfricaSouth AsiaSouth Asia (IDA & IBRD)South SudanSpainSri LankaSt. Kitts and NevisSt. LuciaSt. Vincent and the GrenadinesSub-Saharan Africa Sub-Saharan Africa (excluding high income)Sub-Saharan Africa (IDA & IBRD countries)SudanSurinameSwazilandSwedenSwitzerlandSyrian Arab RepublicTajikistanTanzaniaThailandTimor-LesteTogoTongaTrinidad and TobagoTunisiaTurkeyTurkmenistanTuvaluUgandaUkraineUnited KingdomUnited StatesUpper middle incomeUruguayVanuatuVenezuela, RBVietnamWest Bank and GazaWorldYemen, Rep.ZambiaZimbabwe Timeline:
This timeline shows a graph from 1981 to 2016 of Mozambique. No data until 1980. Number of actual observations by date: 36.
Source name:
World Development Indicators
Source organization:
World Bank staff estimates based on IMF balance of payments data.
Categories, topics:
Economy & Growth, Financial Sector
Last updated:
apr 23, 2017
Indicators value changes by year
Minimum:
15.7 mln
jan 1, 1997
Maximum:
193.87 mln
jan 1, 2015
At the date of observation
Value
Absolute change
Change from previous value
jan 1, 1981
25.3 mln
+25.3 mln
0.0%
jan 1, 1982
29.4 mln
+4.1 mln
16.21%
jan 1, 1983
23.6 mln
-5.8 mln
-19.73%
jan 1, 1984
19.9 mln
-3.7 mln
-15.68%
jan 1, 1985
25.7 mln
+5.8 mln
29.15%
jan 1, 1986
25.0 mln
-700.001K
-2.72%
jan 1, 1987
23.0 mln
-2.0 mln
-8.0%
jan 1, 1988
25.0 mln
+2.0 mln
8.7%
jan 1, 1989
25.3 mln
+299.999K
1.2%
jan 1, 1990
27.5 mln
+2.2 mln
8.7%
jan 1, 1991
25.4 mln
-2.1 mln
-7.64%
jan 1, 1992
29.6 mln
+4.2 mln
16.54%
jan 1, 1993
26.6 mln
-3.0 mln
-10.14%
jan 1, 1994
21.3 mln
-5.3 mln
-19.92%
jan 1, 1995
19.4 mln
-1.9 mln
-8.92%
jan 1, 1996
20.6 mln
+1.2 mln
6.19%
jan 1, 1997
15.7 mln
-4.9 mln
-23.79%
jan 1, 1998
22.9 mln
+7.2 mln
45.86%
jan 1, 1999
31.1 mln
+8.2 mln
35.81%
jan 1, 2000
139.8 mln
+108.7 mln
349.52%
jan 1, 2001
156.2 mln
+16.4 mln
11.73%
jan 1, 2002
64.189 mln
-92.011 mln
-58.91%
jan 1, 2003
49.908 mln
-14.281 mln
-22.25%
jan 1, 2004
29.507 mln
-20.402 mln
-40.88%
jan 1, 2005
20.255 mln
-9.251 mln
-31.35%
jan 1, 2006
24.485 mln
+4.229 mln
20.88%
jan 1, 2007
26.098 mln
+1.613 mln
6.59%
jan 1, 2008
45.25 mln
+19.152 mln
73.39%
jan 1, 2009
56.838 mln
+11.587 mln
25.61%
jan 1, 2010
65.747 mln
+8.909 mln
15.67%
jan 1, 2011
53.681 mln
-12.066 mln
-18.35%
jan 1, 2012
41.487 mln
-12.194 mln
-22.72%
jan 1, 2013
96.202 mln
+54.714 mln
131.88%
jan 1, 2014
99.837 mln
+3.635 mln
3.78%
jan 1, 2015
193.87 mln
+94.034 mln
94.19%
jan 1, 2016
191.556 mln
-2.315 mln
-1.19%
Ranking of countries by current statistics by years


Comments: