29
/
en
AIzaSyAYiBZKx7MnpbEhh9jyipgxe19OcubqV5w
April 1, 2024
54350
Pacific island small states
PSS
false
2
1
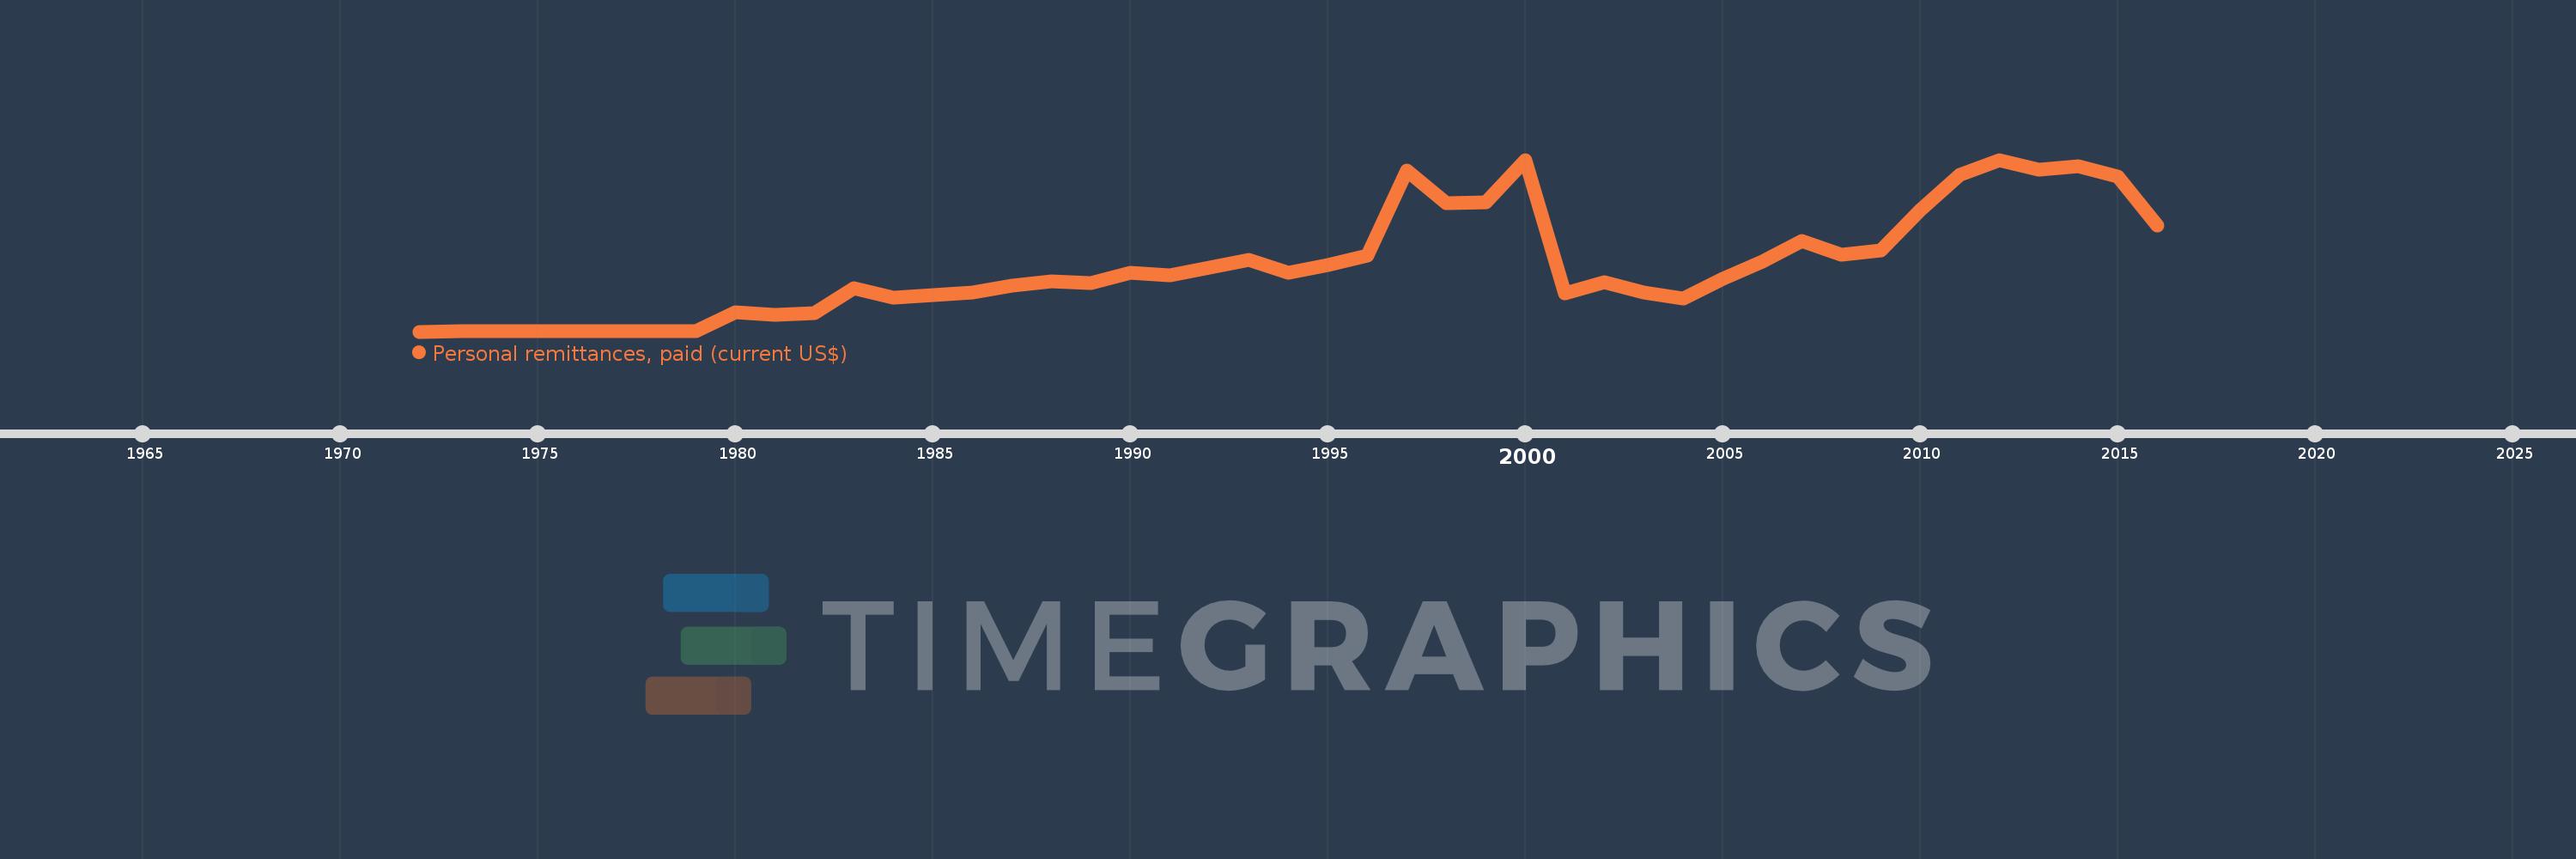
Personal remittances, paid (current US$)
2016,2015,2014,2013,2012,2011,2010,2009,2008,2007,2006,2005,2004,2003,2002,2001,2000,1999,1998,1997,1996,1995,1994,1993,1992,1991,1990,1989,1988,1987,1986,1985,1984,1983,1982,1981,1980,1979,1978,1977,1976,1975,1974,1973,1972
This statistics in other country:
AfghanistanAlbaniaAlgeriaAngolaAntigua and BarbudaArab WorldArgentinaArmeniaArubaAustraliaAustriaAzerbaijanBahamas, TheBahrainBangladeshBarbadosBelarusBelgiumBelizeBeninBermudaBhutanBoliviaBosnia and HerzegovinaBotswanaBrazilBrunei DarussalamBulgariaBurkina FasoBurundiCabo VerdeCambodiaCameroonCanadaCaribbean small statesCentral African RepublicCentral Europe and the BalticsChadChileChinaColombiaComorosCongo, Dem. Rep.Congo, Rep.Costa RicaCote d'IvoireCroatiaCuracaoCyprusCzech RepublicDenmarkDjiboutiDominicaDominican RepublicEarly-demographic dividendEast Asia & PacificEast Asia & Pacific (excluding high income)East Asia & Pacific (IDA & IBRD countries)EcuadorEgypt, Arab Rep.El SalvadorEquatorial GuineaEritreaEstoniaEthiopiaEuro areaEurope & Central AsiaEurope & Central Asia (excluding high income)Europe & Central Asia (IDA & IBRD countries)European UnionFaroe IslandsFijiFinlandFragile and conflict affected situationsFranceFrench PolynesiaGabonGambia, TheGeorgiaGermanyGhanaGreeceGrenadaGuatemalaGuineaGuinea-BissauGuyanaHaitiHeavily indebted poor countries (HIPC)High incomeHondurasHong Kong SAR, ChinaHungaryIBRD onlyIcelandIDA & IBRD totalIDA blendIDA onlyIDA totalIndiaIndonesiaIraqIrelandIsraelItalyJamaicaJapanJordanKazakhstanKenyaKiribatiKorea, Rep.KosovoKuwaitKyrgyz RepublicLao PDRLate-demographic dividendLatin America & Caribbean Latin America & Caribbean (excluding high income)Latin America & the Caribbean (IDA & IBRD countries)LatviaLeast developed countries: UN classificationLebanonLesothoLiberiaLibyaLithuaniaLow & middle incomeLow incomeLower middle incomeLuxembourgMacao SAR, ChinaMacedonia, FYRMadagascarMalawiMalaysiaMaldivesMaliMaltaMarshall IslandsMauritaniaMauritiusMexicoMicronesia, Fed. Sts.Middle East & North AfricaMiddle East & North Africa (excluding high income)Middle East & North Africa (IDA & IBRD countries)Middle incomeMoldovaMongoliaMontenegroMoroccoMozambiqueMyanmarNamibiaNepalNetherlandsNew CaledoniaNew ZealandNicaraguaNigerNigeriaNorth AmericaNorwayOECD membersOmanOther small statesPacific island small statesPakistanPalauPanamaPapua New GuineaParaguayPeruPhilippinesPolandPortugalPost-demographic dividendPre-demographic dividendQatarRomaniaRussian FederationRwandaSamoaSao Tome and PrincipeSaudi ArabiaSenegalSerbiaSeychellesSierra LeoneSint Maarten (Dutch part)Slovak RepublicSloveniaSmall statesSolomon IslandsSomaliaSouth AfricaSouth AsiaSouth Asia (IDA & IBRD)South SudanSpainSri LankaSt. Kitts and NevisSt. LuciaSt. Vincent and the GrenadinesSub-Saharan Africa Sub-Saharan Africa (excluding high income)Sub-Saharan Africa (IDA & IBRD countries)SudanSurinameSwazilandSwedenSwitzerlandSyrian Arab RepublicTajikistanTanzaniaThailandTimor-LesteTogoTongaTrinidad and TobagoTunisiaTurkeyTurkmenistanTuvaluUgandaUkraineUnited KingdomUnited StatesUpper middle incomeUruguayVanuatuVenezuela, RBVietnamWest Bank and GazaWorldYemen, Rep.ZambiaZimbabwe Timeline:
This timeline shows a graph from 1972 to 2016 of Pacific island small states. No data until 1971. Number of actual observations by date: 45.
Source name:
World Development Indicators
Source organization:
World Bank staff estimates based on IMF balance of payments data.
Categories, topics:
Economy & Growth, Financial Sector
Last updated:
apr 23, 2017
Indicators value changes by year
Minimum:
42.016K
jan 1, 1972
Maximum:
137.878 mln
jan 1, 2012
At the date of observation
Value
Absolute change
Change from previous value
jan 1, 1972
42.016K
+42.016K
0.0%
jan 1, 1973
48.828K
+6.812K
16.21%
jan 1, 1974
214.454K
+165.626K
339.2%
jan 1, 1975
142.273K
-72.181K
-33.66%
jan 1, 1976
103.416K
-38.857K
-27.31%
jan 1, 1977
354.386K
+250.97K
242.68%
jan 1, 1978
494.533K
+140.147K
39.55%
jan 1, 1979
565.791K
+71.258K
14.41%
jan 1, 1980
15.397 mln
+14.831 mln
2.62K%
jan 1, 1981
13.784 mln
-1.614 mln
-10.48%
jan 1, 1982
14.824 mln
+1.041 mln
7.55%
jan 1, 1983
34.507 mln
+19.683 mln
132.77%
jan 1, 1984
27.214 mln
-7.294 mln
-21.14%
jan 1, 1985
29.281 mln
+2.068 mln
7.6%
jan 1, 1986
31.529 mln
+2.248 mln
7.68%
jan 1, 1987
36.739 mln
+5.21 mln
16.53%
jan 1, 1988
40.497 mln
+3.758 mln
10.23%
jan 1, 1989
38.799 mln
-1.698 mln
-4.19%
jan 1, 1990
47.424 mln
+8.625 mln
22.23%
jan 1, 1991
45.346 mln
-2.078 mln
-4.38%
jan 1, 1992
51.286 mln
+5.94 mln
13.1%
jan 1, 1993
57.434 mln
+6.148 mln
11.99%
jan 1, 1994
47.186 mln
-10.248 mln
-17.84%
jan 1, 1995
53.531 mln
+6.344 mln
13.45%
jan 1, 1996
60.715 mln
+7.185 mln
13.42%
jan 1, 1997
129.18 mln
+68.465 mln
112.76%
jan 1, 1998
103.15 mln
-26.03 mln
-20.15%
jan 1, 1999
103.698 mln
+548.023K
0.53%
jan 1, 2000
137.524 mln
+33.826 mln
32.62%
jan 1, 2001
30.546 mln
-106.978 mln
-77.79%
jan 1, 2002
39.44 mln
+8.894 mln
29.12%
jan 1, 2003
31.368 mln
-8.072 mln
-20.47%
jan 1, 2004
26.834 mln
-4.533 mln
-14.45%
jan 1, 2005
42.724 mln
+15.89 mln
59.21%
jan 1, 2006
56.093 mln
+13.369 mln
31.29%
jan 1, 2007
73.087 mln
+16.994 mln
30.3%
jan 1, 2008
61.815 mln
-11.272 mln
-15.42%
jan 1, 2009
65.353 mln
+3.538 mln
5.72%
jan 1, 2010
97.277 mln
+31.924 mln
48.85%
jan 1, 2011
125.7 mln
+28.423 mln
29.22%
jan 1, 2012
137.878 mln
+12.178 mln
9.69%
jan 1, 2013
129.939 mln
-7.939 mln
-5.76%
jan 1, 2014
132.774 mln
+2.835 mln
2.18%
jan 1, 2015
124.55 mln
-8.224 mln
-6.19%
jan 1, 2016
84.853 mln
-39.697 mln
-31.87%
Ranking of countries by current statistics by years


Comments: