29
/
en
AIzaSyAYiBZKx7MnpbEhh9jyipgxe19OcubqV5w
April 1, 2024
54353
Pacific island small states
PSS
false
2
1
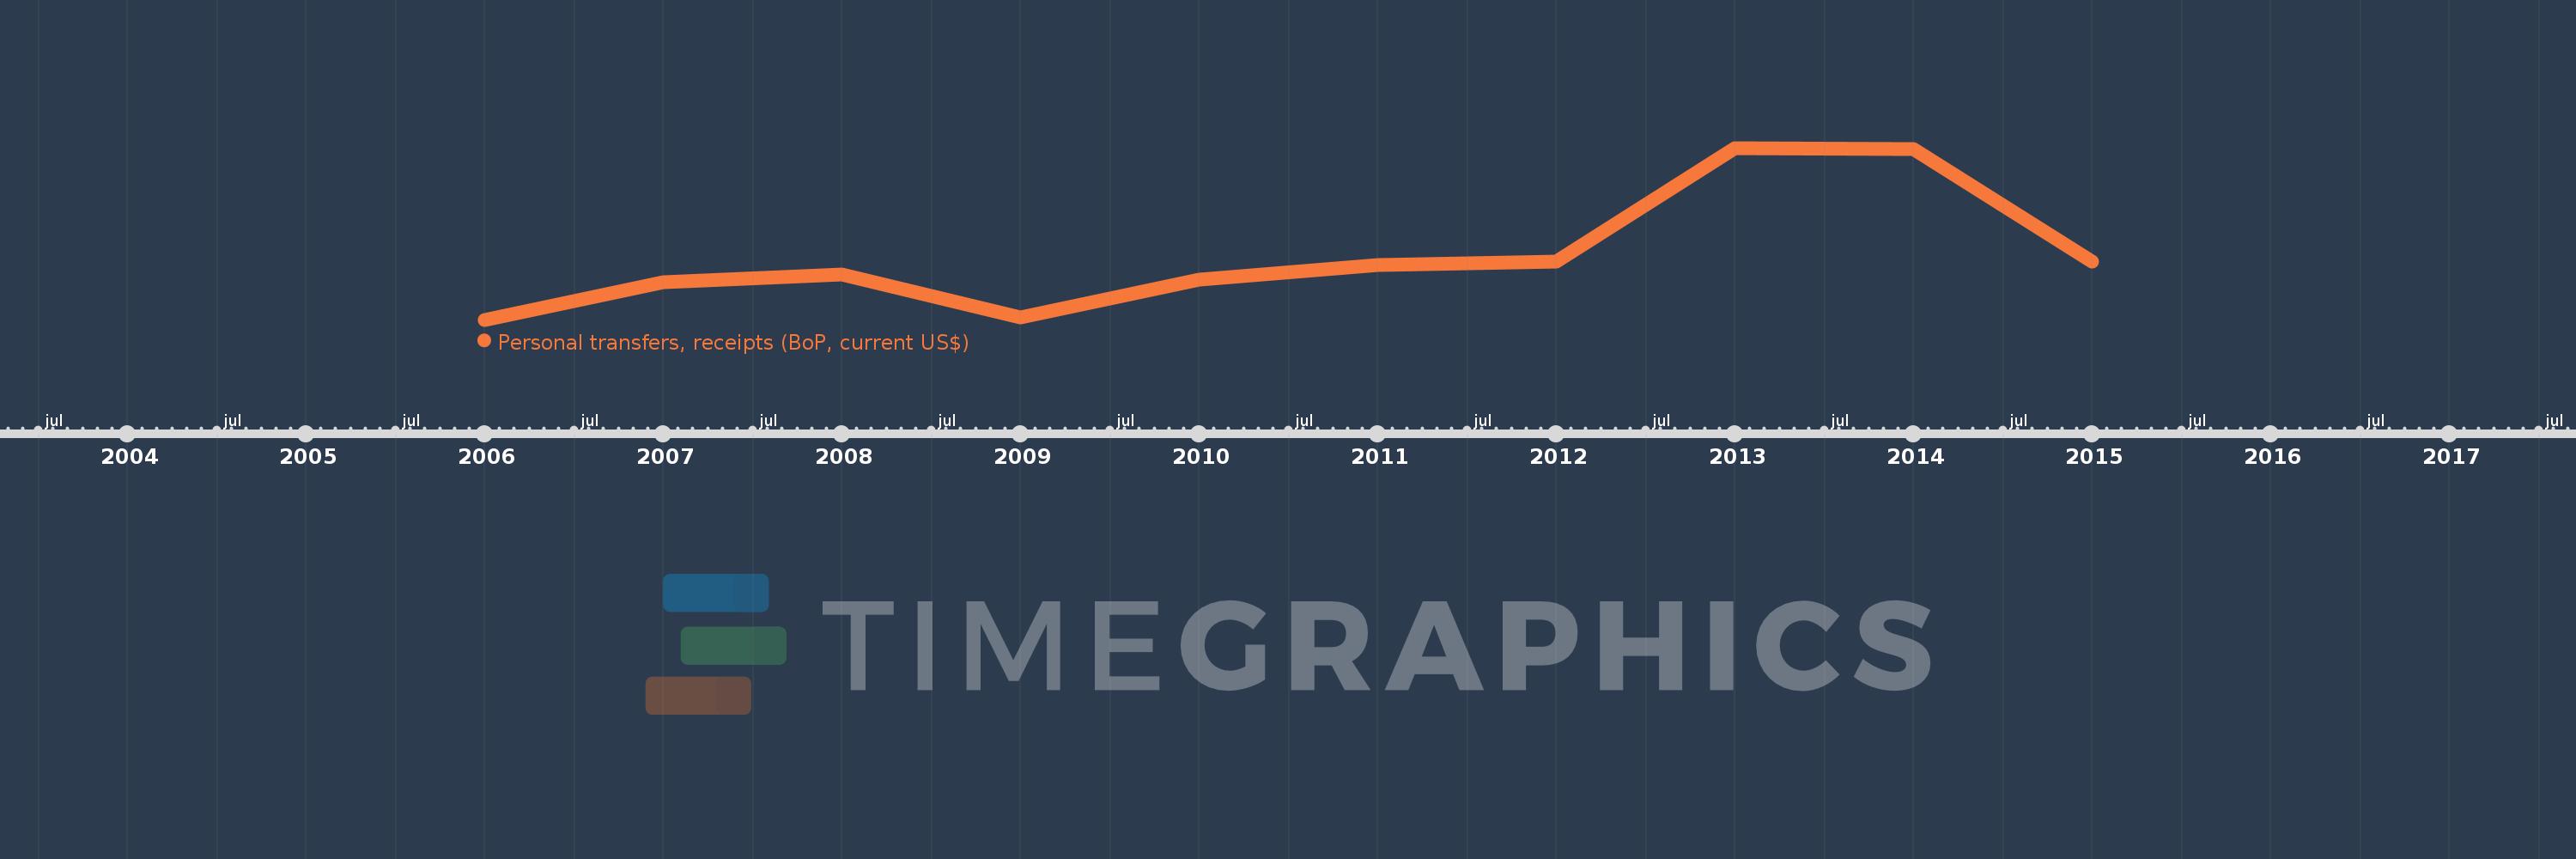
Personal transfers, receipts (BoP, current US$)
2015,2014,2013,2012,2011,2010,2009,2008,2007,2006
This statistics in other country:
Timeline:
This timeline shows a graph from 2006 to 2015 of Pacific island small states. No data until 2005. Number of actual observations by date: 10.
Source name:
World Development Indicators
Source organization:
International Monetary Fund, Balance of Payments Statistics Yearbook and data files.
Categories, topics:
Economy & Growth, Financial Sector
Last updated:
apr 23, 2017
Indicators value changes by year
Minimum:
308.699 mln
jan 1, 2006
Maximum:
467.921 mln
jan 1, 2013
At the date of observation
Value
Absolute change
Change from previous value
jan 1, 2006
308.699 mln
+308.699 mln
0.0%
jan 1, 2007
343.832 mln
+35.133 mln
11.38%
jan 1, 2008
350.824 mln
+6.992 mln
2.03%
jan 1, 2009
310.731 mln
-40.093 mln
-11.43%
jan 1, 2010
345.833 mln
+35.101 mln
11.3%
jan 1, 2011
359.047 mln
+13.215 mln
3.82%
jan 1, 2012
362.575 mln
+3.528 mln
0.98%
jan 1, 2013
467.921 mln
+105.345 mln
29.05%
jan 1, 2014
467.162 mln
-758.406K
-0.16%
jan 1, 2015
362.201 mln
-104.962 mln
-22.47%
Ranking of countries by current statistics by years


Comments: