29
/
en
AIzaSyAYiBZKx7MnpbEhh9jyipgxe19OcubqV5w
April 1, 2024
198043
Moldova
MDA
true
2
1
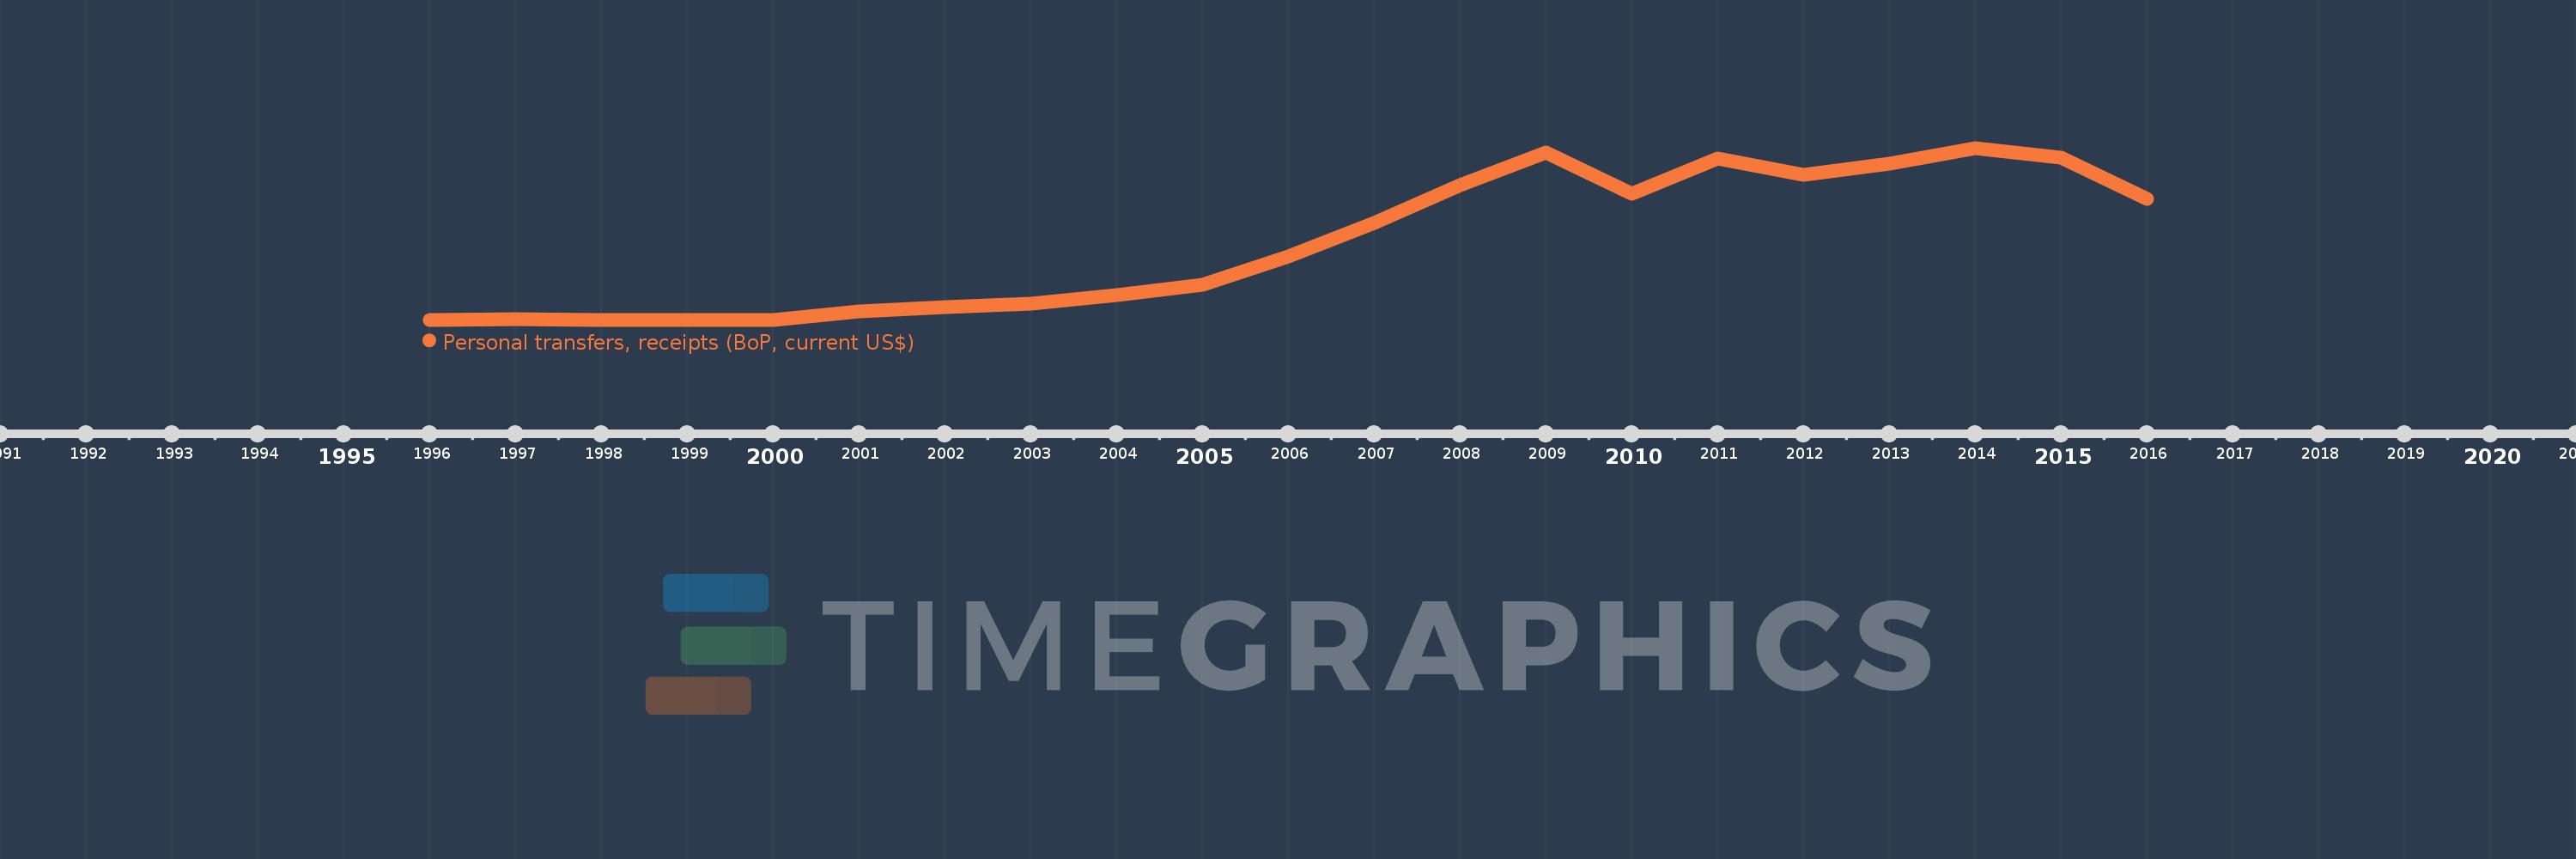
Personal transfers, receipts (BoP, current US$)
2016,2015,2014,2013,2012,2011,2010,2009,2008,2007,2006,2005,2004,2003,2002,2001,2000,1999,1998,1997,1996
This statistics in other country:
Timeline:
This timeline shows a graph from 1996 to 2016 of Moldova. No data until 1995. Number of actual observations by date: 21.
Source name:
World Development Indicators
Source organization:
International Monetary Fund, Balance of Payments Statistics Yearbook and data files.
Categories, topics:
Economy & Growth, Financial Sector
Last updated:
apr 23, 2017
Indicators value changes by year
Minimum:
610.0K
jan 1, 2000
Maximum:
1.074 bln
jan 1, 2014
At the date of observation
Value
Absolute change
Change from previous value
jan 1, 1996
1.02 mln
+1.02 mln
0.0%
jan 1, 1997
3.08 mln
+2.06 mln
201.96%
jan 1, 1998
1.32 mln
-1.76 mln
-57.14%
jan 1, 1999
1.17 mln
-150.0K
-11.36%
jan 1, 2000
610.0K
-560.0K
-47.86%
jan 1, 2001
52.58 mln
+51.97 mln
8.52K%
jan 1, 2002
80.21 mln
+27.63 mln
52.55%
jan 1, 2003
101.59 mln
+21.38 mln
26.66%
jan 1, 2004
152.02 mln
+50.43 mln
49.64%
jan 1, 2005
221.37 mln
+69.35 mln
45.62%
jan 1, 2006
395.08 mln
+173.71 mln
78.47%
jan 1, 2007
602.82 mln
+207.74 mln
52.58%
jan 1, 2008
842.26 mln
+239.44 mln
39.72%
jan 1, 2009
1.046 bln
+203.76 mln
24.19%
jan 1, 2010
788.93 mln
-257.09 mln
-24.58%
jan 1, 2011
1.01 bln
+220.94 mln
28.01%
jan 1, 2012
905.41 mln
-104.46 mln
-10.34%
jan 1, 2013
976.49 mln
+71.08 mln
7.85%
jan 1, 2014
1.074 bln
+97.03 mln
9.94%
jan 1, 2015
1.012 bln
-61.44 mln
-5.72%
jan 1, 2016
756.97 mln
-255.11 mln
-25.21%
Ranking of countries by current statistics by years


Comments: